Dr. Farah Taqueer is a pediatrician based in Karachi with more than 14 years of clinical experience. She qualified with an MBBS from Liaquat University of Medical and Health Sciences and holds an MD in Pediatrics, and is registered with...
Your daily water intake is not eight glasses, and it is not half your body weight in ounces. It depends on how big you are, how hard you train, how hot it is where you live, and how old you are. Enter those four things and this Water Intake Calculator gives you a number in liters, ounces, cups and 500 ml bottles, plus the hourly pace that actually gets you there. It also shows the guideline floor for your group, so you can see whether your number is a comfortable target or a bare minimum.
What Is Daily Water Intake?
Daily water intake is the total fluid you need each day to replace what you lose through breathing, sweating, urine and digestion. Most adults land between 2 and 4 liters, and the spread is enormous. When researchers measured it rather than estimating it, water turnover in 5,604 people across 23 countries varied with age, body size, body composition, activity, athletic status, pregnancy, latitude, altitude, temperature and humidity. All of it. That is why one universal number cannot work, and why this tool asks four questions instead of one.
Lose about 2% of your body weight in fluid and performance starts to slip, which is the threshold the American College of Sports Medicine uses to define meaningful dehydration.
How This Calculator Works (The Formula Behind Your Number)
Most calculators multiply your weight by one flat rate and stop. This one runs four adjustments, then checks the answer against a published guideline floor:
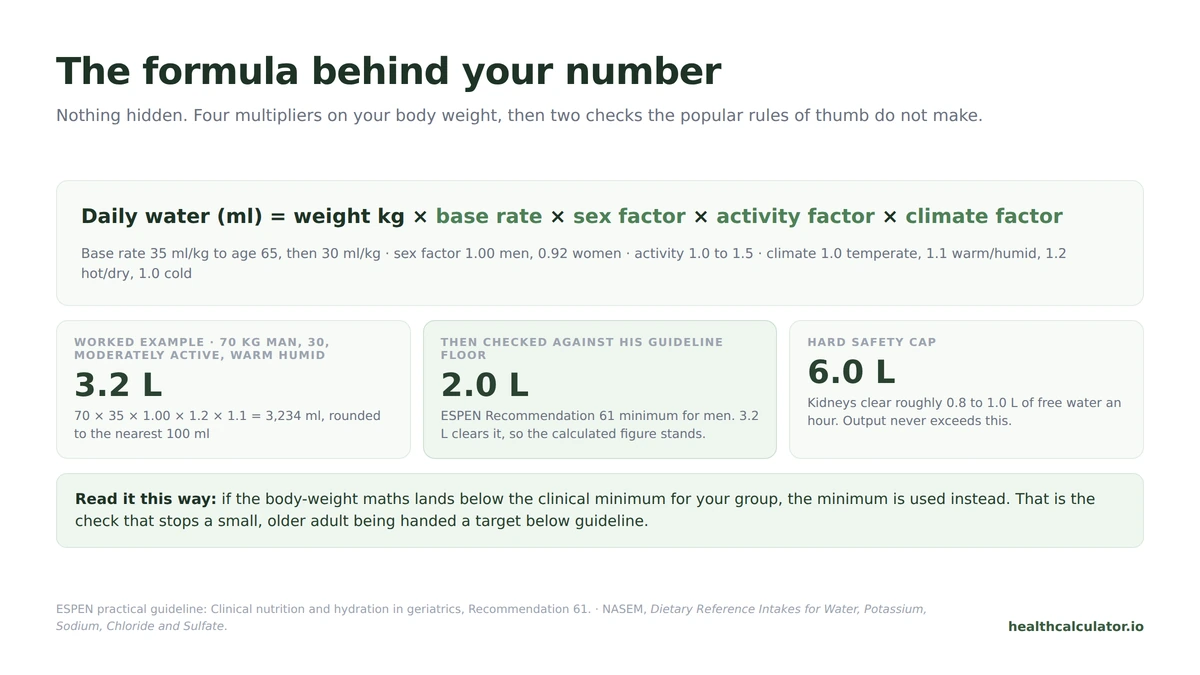
Daily water (ml) = weight in kg × base rate × sex factor × activity factor × climate factor
If that result falls below the guideline minimum for your group, the minimum is used instead. The result rounds to the nearest 100 ml.
Base rate by age. 35 ml per kg up to 65, then 30 ml per kg. It eases down because total body water falls with age, but not far, and there is a floor underneath it.
Sex factor. Women 0.92, men 1.0. Small on purpose: body weight already carries most of the difference, so a heavier multiplier would double-count it.
Activity factor. Sedentary 1.0, lightly active 1.1, moderately active 1.2, very active 1.35, extremely active 1.5.
Climate factor. Temperate 1.0, warm or humid 1.1, hot or dry 1.2. Cold is also 1.0, not less: indoor heating and cold dry air both increase what you lose through skin and breath, so winter is no discount.
The floor. For adults it comes from the ESPEN geriatric guideline, which recommends at least 1.6 L of drinks daily for older women and at least 2.0 L for older men. Pregnancy and breastfeeding use the NASEM adequate intakes instead: 3.0 L and 3.8 L of total water, which works out at about 2.4 L and 3.1 L from drinks once you take off the share that comes from food.
A Worked Example You Can Reproduce
A 70 kg man, age 30, moderately active, warm humid climate:
70 × 35 × 1.0 × 1.2 × 1.1 = 3,234 ml, rounding to 3.2 L per day.
That shows as 108 fl oz, 14 cups, 6.4 bottles of 500 ml, and 6.8 oz per waking hour. His floor is 2.0 L, so 3.2 L clears it comfortably and reads Elevated, driven by the training load and the humidity.
Switch to female and it becomes 70 × 35 × 0.92 × 1.2 × 1.1 = 2,975 ml, or 3.0 L.
Your Result Category, Explained
The label says where your requirement sits relative to your own floor. It is not a grade, and it never tells you your own target is too low, which would be a contradiction.
Your target vs your floor
Label
What it means
Up to 1.15×
Baseline
Around the minimum for your profile. A floor to clear, not a target to beat.
1.15 to 1.5×
Typical
A normal requirement for your body size and routine.
1.5 to 2×
Elevated
Higher than average, driven by size, training or heat.
Over 2×
High
Well above average. Pace it, and replace electrolytes, not just water.
Why Your Number Can Sit Below 2.7 Liters
This trips up almost everyone, and almost no calculator explains it.
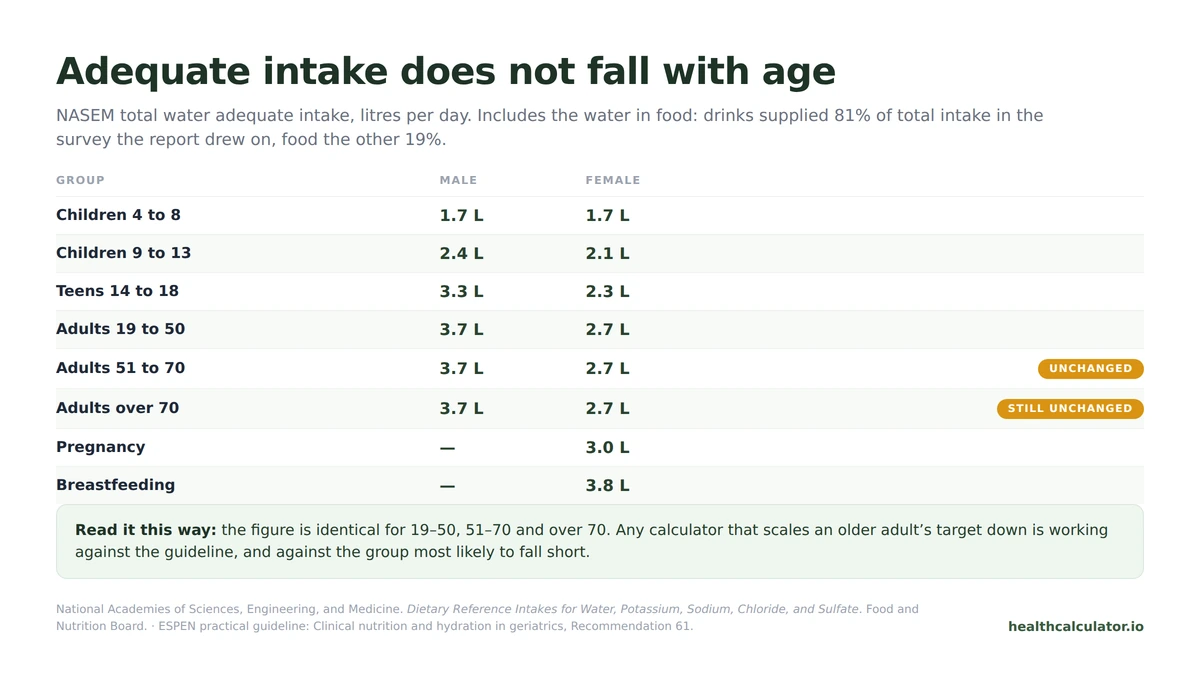
You have seen the figures 3.7 L for men and 2.7 L for women. Those come from the NASEM dietary reference intakes and they are Adequate Intakes, not minimum requirements. An Adequate Intake is set from what healthy, well-hydrated populations were already drinking. It is a population benchmark, it includes the water in your food, and NASEM is clear that people below it are not automatically dehydrated. In the US survey the report drew on, drinks supplied about 81% of total water intake and food the other 19%.
The floor in this calculator is a different kind of number. ESPEN's 1.6 L and 2.0 L are clinical minimums: the volume of drinks below which an older adult is considered at risk. So a small, sedentary 78-year-old woman can be perfectly well hydrated on 1.7 L of drinks while sitting below the 2.7 L population figure, because that figure was never a requirement for her.
Two things follow. If your result is below the population number, you are not doing something wrong. And if it is far above, that is your body size and sweat rate talking, not a license to force fluid.
How This Compares To The Other Three Methods
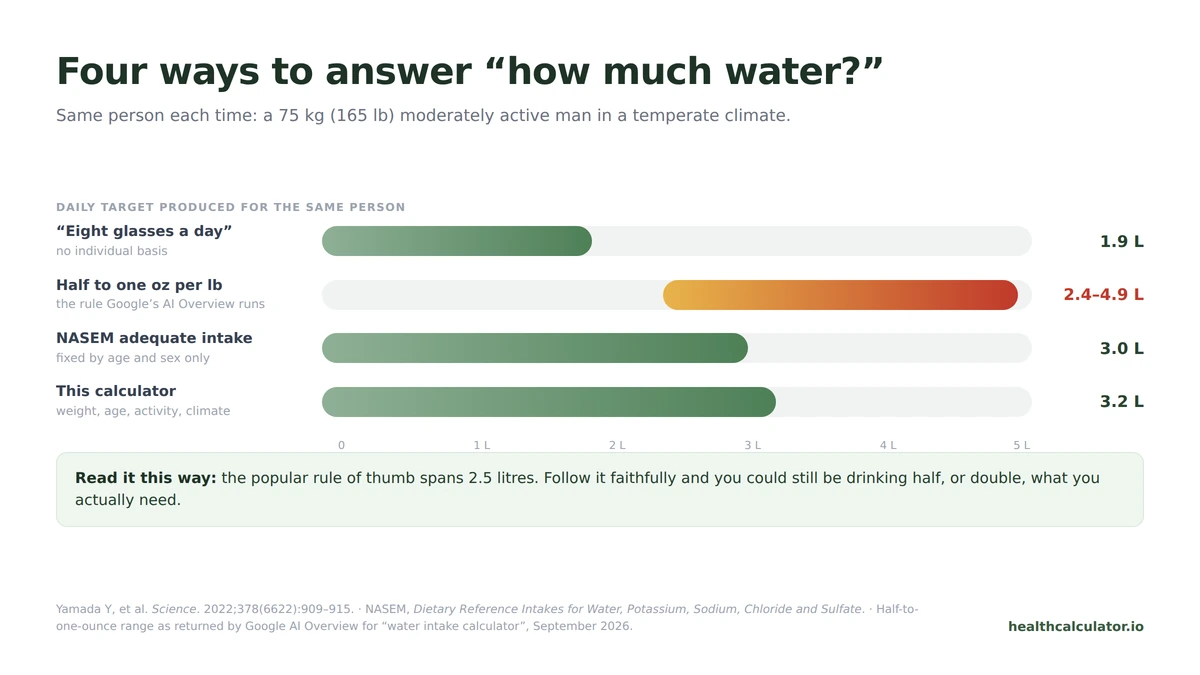
Three methods dominate search results. Here is what each gives a 75 kg (165 lb) moderately active man in a temperate climate, and where each breaks.
Method
Result
The problem with it
"Eight glasses a day"
1.9 L
No individual basis. The Science measurement study found turnover varies so widely by body size, activity and climate that one figure cannot serve anyone in particular.
Half to one ounce per pound
2.4 to 4.9 L
A 2× spread presented as an answer. Google's own AI Overview runs this rule and returns "96 to 176 ounces" for a 160 lb person. The top of that range needs an electrolyte warning that never comes with it.
NASEM adequate intake / USDA DRI Calculator
3.0 L of beverages
Correct, but fixed by age and sex only. It cannot know you weigh 75 kg, train five days a week, or live in Karachi rather than Copenhagen.
This calculator
3.2 L
Body size, activity and climate applied, then floored at the ESPEN minimum and capped at 6 L.
The pattern worth noticing: the popular rules are either too blunt to be personal or too loose to be useful. The half-to-one-ounce rule manages both, because a 2× range means you can follow it faithfully and still drink half or double what you need.
There Is A Ceiling, Not Just A Floor
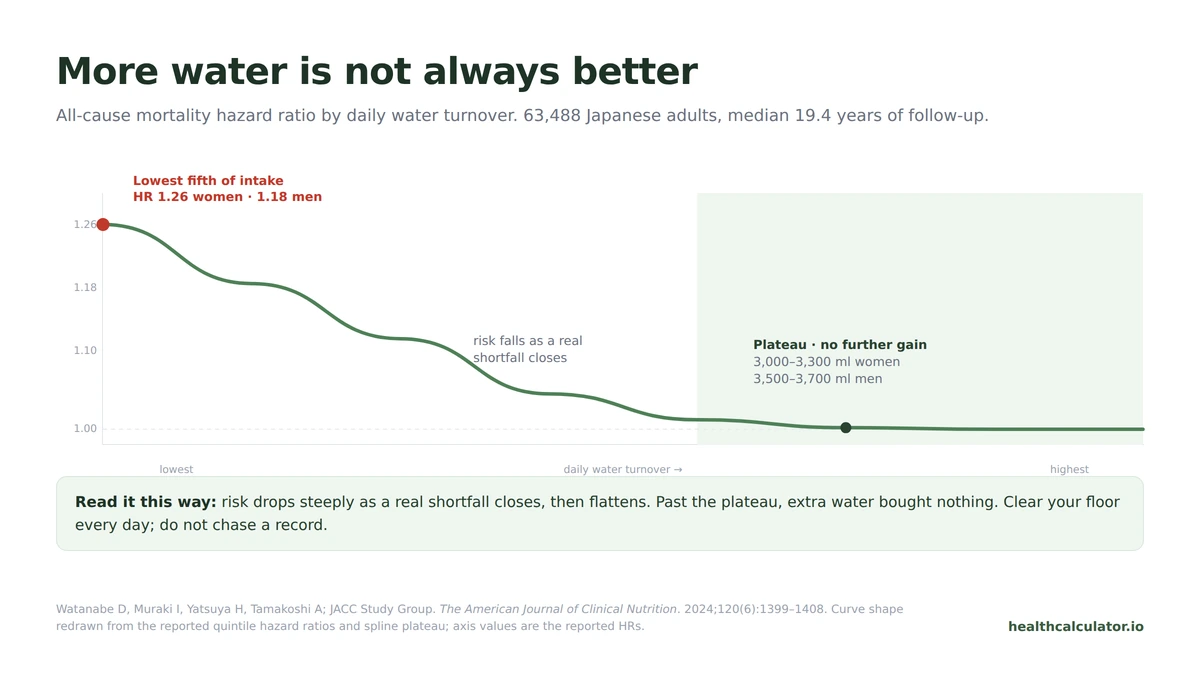
Almost every page on this topic tells you to drink more. The newer evidence says the benefit runs out.
Two cohort studies now describe the relationship as L-shaped: it drops steeply as you move off the low end, then flattens. In 63,488 Japanese adults followed for a median 19.4 years, the lowest fifth of water turnover carried higher all-cause mortality, with a hazard ratio of 1.26 in women and 1.18 in men. But the range with the lowest hazard was 3,000 to 3,300 ml a day in women, and in men the curve simply plateaued around 3,500 to 3,700 ml. Past the plateau, more water bought nothing.
The same shape showed up in US data. Among 9,332 American adults in NHANES, the least water-deficient quartile had a lower prevalence of chronic kidney disease, with an odds ratio of 0.71, and the curve flattened once the deficit reached roughly −30% to zero. Closing a real shortfall mattered. Overshooting added nothing.
A third study points the same way. Following 11,255 adults from the ARIC cohort for 25 years, serum sodium above 142 mmol/L came with a 39% higher risk of chronic disease. But the lowest-risk band was 138 to 142 mmol/L, with risk rising at both ends, and the authors say plainly that interventional trials are needed before anyone claims causation.
So the goal is to clear your floor consistently, every day, for years. Not to hit a personal record.
How To Use Your Oz-Per-Hour Number
Drinking a day's water in two sittings is the most common way people get this wrong. The NASEM report puts the kidney's maximum excretion capacity at roughly 0.7 to 1.0 liters an hour, so catching up at 9 PM means much of it leaves as urine and some dilutes your blood sodium on the way through. How much water is too much covers what happens past that limit, and why the honest answer is a per-hour number rather than a daily one.
The hourly figure divides your target across 16 waking hours. Our 70 kg example gets 3.2 L, which is 0.2 L or about 6.8 oz per hour. One modest glass an hour and you are done. Compare that to "drink 108 oz today," the same instruction with the useful part removed.
Coffee and tea count toward it. Does coffee count as water has the trial data and the dose where that stops being true.
Signs and Symptoms of Dehydration
Thirst is a late alarm, not an early one. Early signs are dry mouth, fatigue, a mild headache and dizziness on standing. Larger losses bring a persistent headache, cramps, a faster heartbeat and noticeably less urine.
Urine color
Likely status
What to do
Pale straw
Well hydrated
Carry on
Dark yellow
Mildly dehydrated
Drink one or two glasses now
Amber or honey
Moderately dehydrated
Drink now
Orange or brown
Possibly severe, or something else
Get medical advice
The caveat matters. B vitamins, beetroot and several medicines change urine color independently of hydration, and a review of 13 hydration assessment techniques found no single measurement is valid in all situations. In older adults, urinary tests performed poorly at detecting water-loss dehydration. Use color as a nudge, not a verdict.
Confusion, no urine for eight hours, or loss of consciousness is an emergency, not a hydration question. Fever, uncontrolled diabetes and diuretics all push requirements well above anything this calculator produces.
Water Intake During Exercise: The Method, Not A Number
Here is where most advice goes wrong, including the version that used to be on this page. The ACSM position stand does not prescribe a fixed volume per half hour. It says the opposite: because sweat rates and sweat sodium vary so much between individuals, customized fluid replacement programs are recommended, and you estimate your own sweat rate by weighing yourself before and after exercise.
That is a two-minute job and it beats any table:
Weigh yourself in minimal clothing before a typical session.
Train as normal, noting what you drink.
Weigh yourself after, toweled dry.
Weight lost plus fluid drunk equals your sweat loss. Divide by the hours for your hourly rate.
Our sweat rate calculator runs that arithmetic for you in metric or imperial, and puts your hourly rate next to published norms for five sports.
Then keep losses under 2% of body weight during the session and replace the deficit afterwards, electrolytes included. Past an hour, or any session where you finish visibly salty, water alone is the wrong drink. Replacing heavy sweat losses with plain water is the mechanism behind exercise-associated hyponatremia.
Your activity setting above already accounts for your usual training load, so do not add a generic exercise bonus on top. That double-counts. If you are dialing in training nutrition, our protein calculator uses the same activity levels.
Can Drinking More Water Help With Weight Loss?
Modestly, and mostly through one mechanism: a glass before meals.
A 2024 systematic review in JAMA Network Open gathered 18 randomized trials. Four looked at weight, and three found greater weight loss when adults with overweight or obesity drank about 500 ml before meals, by 44%, 87% and roughly 100% more than controls. The fourth, in adolescents, found nothing. The review's own verdict is that the evidence is limited, and 8 of the 18 trials reported negative results.
So: worth doing, free, low risk, not a strategy on its own. Swapping two sugary drinks a day for water is the bigger win, and you can check that side with our Starbucks calorie calculator.
The same review found stronger signals elsewhere: in people who had passed one calcium kidney stone, drinking enough to produce 2 liters of urine daily cut five-year recurrence from 27 in 100 to 12 in 100. That is where water earns its reputation.
Children And Teens
A child is not a scaled-down adult, and the adult formula gets them badly wrong. Under 18, this calculator switches method: it takes the Holliday-Segar maintenance rule (100 ml/kg for the first 10 kg, 50 ml/kg for the next 10, 20 ml/kg after that), checks it against the NASEM adequate intake for that age band, uses whichever is higher, then takes the 81% that NASEM attributes to drinks rather than food.
A 20 kg six-year-old comes out near 1.7 L of drinks on a normal day. Children heat up faster than adults and have a weaker thirst drive, so heat and sport matter more for them, not less. Treat any child's number as a starting point for a conversation with a pediatrician.
Older Adults: The Counterintuitive Bit
Fluid needs barely drop with age, and the risk runs the other way. NASEM sets the same adequate intake for 19–50, 51–70 and over 70. ESPEN goes further, warning that dehydration affects more than a third of frailer older adults and setting that 1.6 L and 2.0 L floor precisely because the group is prone to falling short.
Thirst sensitivity does decline, so waiting to feel thirsty stops working around this age. A glass with each meal and one in between, on a schedule, does the job. If kidney function is a concern, our eGFR calculator estimates filtration rate, and anyone on diuretics or a fluid restriction should follow their clinician's number rather than this one.
What This Calculator Cannot Tell You
Worth being straight about the limits.
It cannot measure your sweat rate, the single largest source of variation between two people of the same size. It cannot see your kidney or heart function, and both change the answer completely: in heart failure or advanced kidney disease fluid is often deliberately restricted, and a calculator that only knows your weight will be wrong in a way that matters. Also, it does not know about fever, vomiting, diarrhea or diuretics. It counts drinks, not the water in food, and it gives a daily average while your real needs swing with the weather.
The 6 liter cap is our own editorial limit, not a guideline figure. No official body sets a daily ceiling for water: NASEM declined to set a Tolerable Upper Intake Level at all, on the grounds that healthy people can excrete the excess. What is published is a rate ceiling of roughly 0.7 to 1.0 liters an hour, and the same report notes acute water toxicity has happened when intake outran it. We cap at 6 L because past that point a number belongs with a sports dietitian who can weigh you around sessions, not with a calculator.
Water Intake Should Not Replace Medical Advice
This calculator is for informational and screening purposes only and does not constitute medical advice, diagnosis or treatment. Always consult a qualified healthcare professional for personalized guidance, particularly if you have kidney disease, heart failure, liver disease, or take diuretics or any medicine affecting fluid balance.
Key Takeaways
Your requirement is personal. Weight, age, sex, activity and climate all move it, and measured turnover varies hugely between people.
The 2.7 to 3.7 L figures are population adequate intakes including food water, not minimums. Sitting below them is not automatically a problem.
There is a floor and a plateau. Clearing your floor every day is what the cohort data supports; exceeding it by a lot does nothing.
Older adults need the same intake as younger adults and are likelier to fall short. Under-18s need a different formula entirely.
Frequently Asked Questions
Most healthy adults need between 2 and 4 liters of fluid a day, and where you land inside that depends on your body weight, activity level, climate and age. The widely quoted 3.7 L for men and 2.7 L for women are population adequate intakes that include the water in food. Use the calculator above for your own figure.
A sedentary 70 kg man in a temperate climate works out at about 2.5 L of drinks a day, and a 70 kg woman about 2.3 L. Moderate exercise in a warm humid climate lifts the same man to roughly 3.2 L. Weight alone cannot answer it, which is why the calculator asks for activity and climate too.
For many smaller or sedentary adults in a cool climate, yes. For a larger person, anyone training regularly, or anyone in heat, it falls short. It comfortably clears the ESPEN clinical minimum of 1.6 to 2.0 L of drinks, so 2 L is rarely too little. It is often not enough.
No. The relationship is L-shaped. In 63,488 Japanese adults, mortality risk was highest in the lowest fifth of water turnover, then flattened out around 3,000 to 3,300 ml a day in women and 3,500 to 3,700 ml in men. Clearing a genuine shortfall helps. Going well past the plateau adds nothing.
Yes, though it is rare and it is about rate more than daily total. NASEM puts the kidney's maximum excretion capacity at roughly 0.7 to 1.0 liters an hour. When six healthy adults drank 0.9 to 1.8 liters an hour for three hours, plasma sodium fell from 144 to 136 mmol/L despite normal kidney function.
Yes. Coffee counts toward your daily total and does not need subtracting. In habitual coffee drinkers, four cups a day left total body water and 24-hour urine volume no different from water. It is less settled for people unused to caffeine, which our coffee and hydration guide breaks down by dose./p>
Adult formulas do not transfer to children. NASEM sets total water adequate intakes of 1.7 L for ages 4 to 8, 2.4 L for boys and 2.1 L for girls aged 9 to 13, and 3.3 L and 2.3 L for ages 14 to 18, including food water. Set the age below 18 and the calculator switches to the pediatric method. Confirm any child's target with a pediatrician.
The ACSM position stand recommends a customized programme rather than a fixed volume, because sweat rates vary so widely. Weigh yourself before and after a typical session: weight lost plus fluid drunk is your sweat loss. Aim to keep losses under 2% of body weight, and add electrolytes for sessions over an hour.
Sources
Every figure on this page is drawn from government health statistics, clinical guidelines or peer-reviewed research. Last verified September 2026.
National Academies of Sciences, Engineering, and Medicine. Water (Chapter 4), in Dietary Reference Intakes for Water, Potassium, Sodium, Chloride, and Sulfate. National Academies Press. States that no Tolerable Upper Intake Level was set for water, and gives renal excretion capacity as approximately 0.7 to 1.0 L/hour.