Dr. Farah Taqueer is a pediatrician based in Karachi with more than 14 years of clinical experience. She qualified with an MBBS from Liaquat University of Medical and Health Sciences and holds an MD in Pediatrics, and is registered with...
This A1C calculator converts your result into estimated average glucose using the ADAG equation the American Diabetes Association adopted: eAG = 28.7 × A1C − 46.7. It runs backwards too, and it calculates GMI separately if your number came off a CGM. Most tools skip that last part, and that is exactly where people get confused.
A1C to blood sugar chart, both directions
Find your number and read across. The calculator handles anything in between.
A1C to estimated average glucose
A1C
mg/dL
mmol/L
mmol/mol
5.0%
97
5.4
31
5.2%
103
5.7
33
5.4%
108
6.0
36
5.6%
114
6.3
38
5.8%
120
6.6
40
6.0%
125
7.0
42
6.2%
131
7.3
44
6.4%
137
7.6
46
6.6%
143
7.9
49
6.8%
148
8.2
51
7.0%
154
8.6
53
7.2%
160
8.9
55
7.4%
166
9.2
57
7.6%
171
9.5
60
7.8%
177
9.8
62
8.0%
183
10.2
64
8.2%
189
10.5
66
8.4%
194
10.8
68
8.6%
200
11.1
70
8.8%
206
11.4
73
9.0%
212
11.7
75
9.2%
217
12.1
77
9.4%
223
12.4
79
9.6%
229
12.7
81
9.8%
235
13.0
84
10.0%
240
13.3
86
10.5%
255
14.1
91
11.0%
269
14.9
97
11.5%
283
15.7
102
12.0%
298
16.5
108
Average glucose back to A1C
The estimated A1C column suits finger-stick averages. The GMI column is the right one for CGM data, and the two are not interchangeable.
Two catches. A diagnosis needs a lab running an NGSP-certified method, so a home kit or a meter average does not count. And a single abnormal result confirms nothing until it is repeated. If weight is the lever you are working on, our BMI calculator is a reasonable next checkpoint, though visceral fat tracks blood sugar risk more directly: a 2025 analysis of 8,286 US adults put the type 2 diabetes threshold at 119 cm².
The formula, and the range it quietly hides
Every A1C calculator online runs the same arithmetic:
eAG (mg/dL) = 28.7 × A1C − 46.7
Divide that by 18.0182 for mmol/L. Worked example: an A1C of 7.2% gives 28.7 × 7.2 = 206.6, minus 46.7 = 160 mg/dL, or 8.9 mmol/L.
Now the part nobody puts on the page.
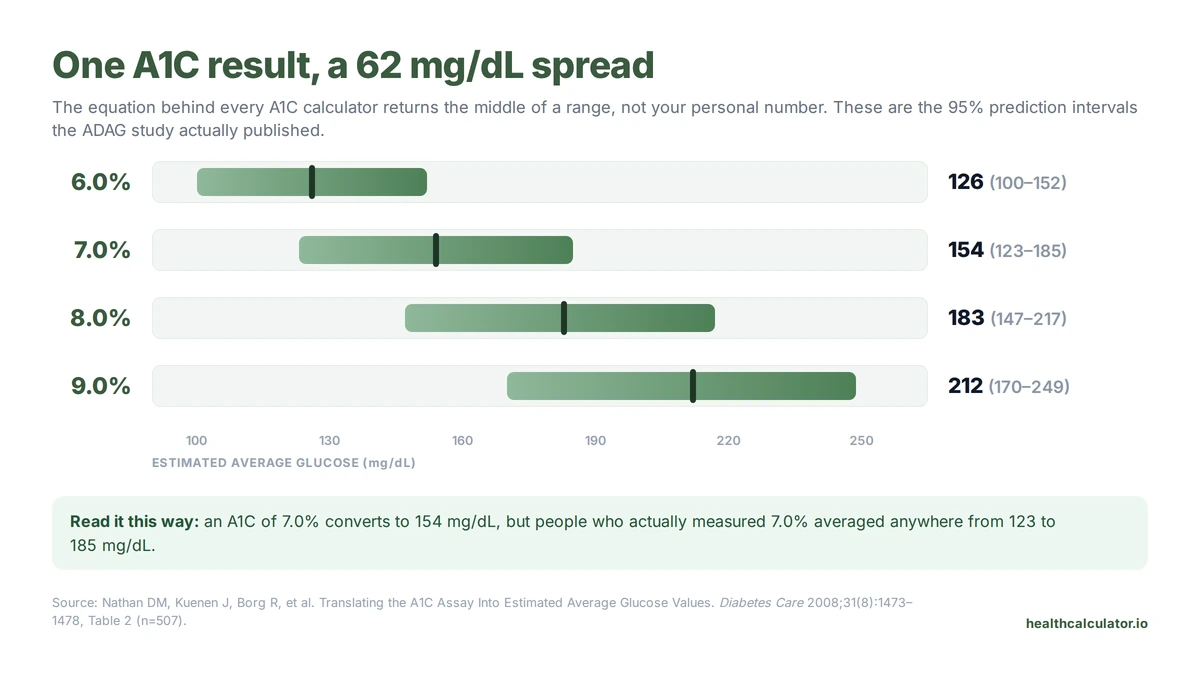
That equation came from 507 people, about 2,700 glucose readings each, with a strong R² of 0.84. Strong is not the same as exact, and the same study published prediction intervals that almost nobody quotes.
At 7.0%, the calculator says 154 mg/dL. The people who actually measured 7.0% averaged anywhere from 123 to 185 mg/dL. Same number on paper, a 62 mg/dL spread in real life. That is not a bug in the maths, it is what a population average looks like applied to one person. Read your eAG as a centre point, not a reading. When the GRADE group re-tested the formula in 2026 against CGM data from 1,325 people, it explained about 68% of the variation in real measured glucose.
Using a CGM? You want GMI, not this
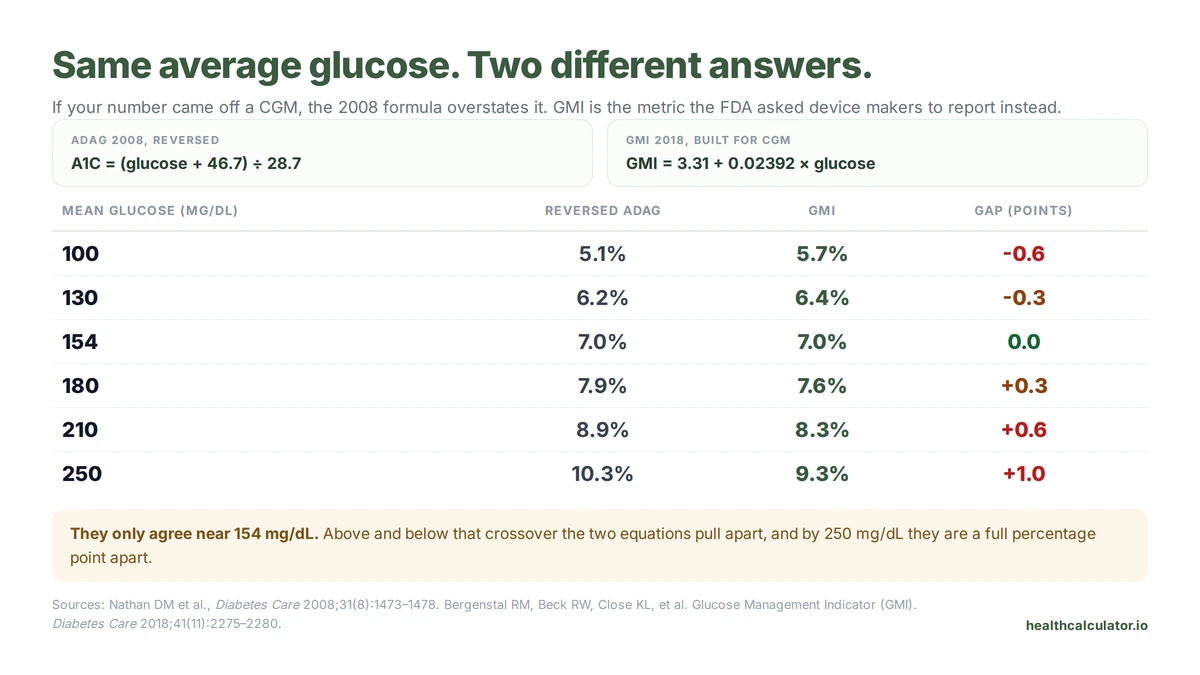
If your number came from a Dexcom or a Libre, the reversed ADAG equation is the wrong tool, and the gap is not small.
In 2018 the FDA's device division asked the field to stop calling CGM estimates "estimated A1C", because people kept expecting them to match a lab result. The replacement is the Glucose Management Indicator:
GMI (%) = 3.31 + 0.02392 × mean glucose (mg/dL)
The two cross near 154 mg/dL and separate everywhere else. At 250 mg/dL the old formula says 10.3% and GMI says 9.3%. If an online calculator has ever disagreed with your AGP report, that is usually why.
Even GMI will not match your lab. In its source data of 528 people, the two differed by 0.3 points or more 51% of the time. Expected, not an error.
When your A1C and your meter disagree
This is the question I get asked most, and page-one results tend to skip it.
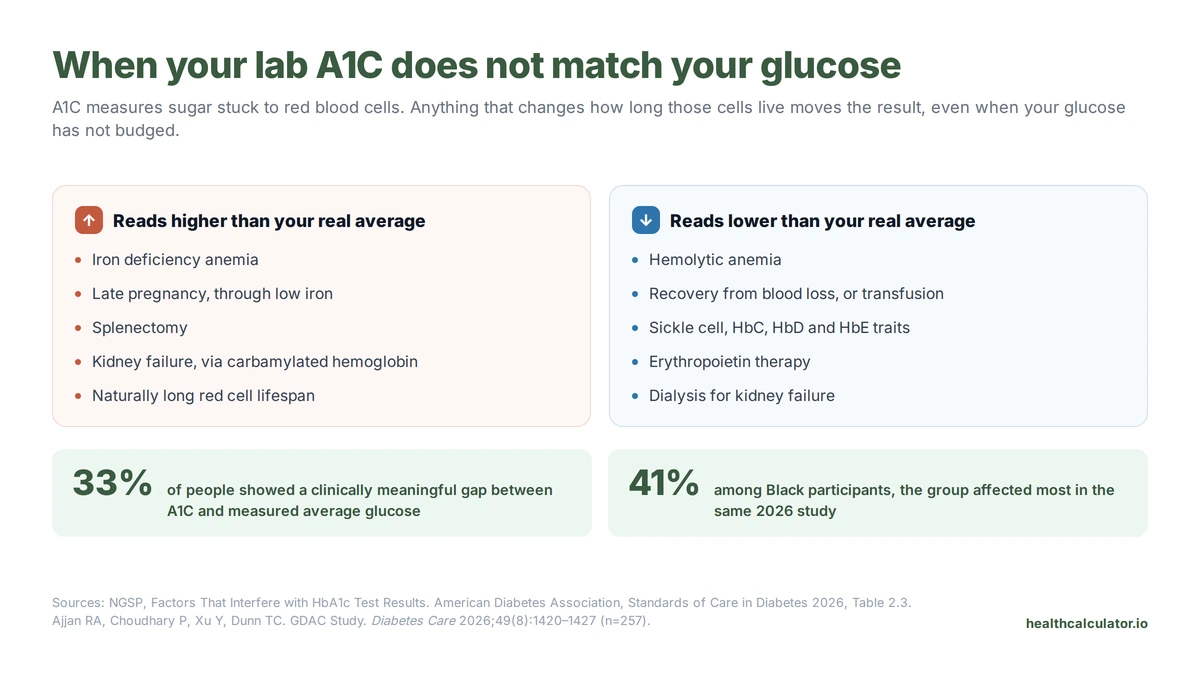
A1C is a proxy. It measures glycation on red blood cells, so anything that changes how long those cells survive moves your result even when your glucose has not budged. Iron deficiency anemia pushes it up. Hemolytic anemia and recent blood loss pull it down.
How common? A 2026 study followed 257 people on continuous monitoring for 26 weeks and found 33% had a gap of half a percentage point or more between A1C and measured average glucose. Among Black participants it was 41%. The authors built a personalised correction that cut the mismatch to 14%, though it needs your own CGM history and no public converter can do it for you. Worth knowing: that study was funded by Abbott, a CGM manufacturer.
What to actually do. If your meter and your lab keep telling different stories, do not average them and do not assume one is broken. Bring both sets of numbers to your doctor and ask whether fructosamine or glycated albumin makes sense, since neither depends on red cell lifespan. With kidney disease in the picture, our eGFR calculator is worth bringing along, because dialysis and erythropoietin both drag A1C down.
How this A1C Calculator compares to the ADA and MDCalc converters
Three tools get used most for this. They are built for different people.
Feature
This calculator
ADA eAG converter
MDCalc eAG tool
A1C to eAG
Yes
Yes
Yes
Glucose back to A1C
Yes
Yes
No, one direction
GMI for CGM
Yes
No
Mentions it, does not calculate
mmol/mol output
Yes
No
No
Shows the uncertainty range
Yes
No
No
Built for
Reading your own lab report
Clinicians and educators
Clinicians at the bedside
Straight answer: if you want the official number from the body that set the standard, the ADA's converter is canonical and you should trust it. MDCalc is excellent and is what many clinicians actually open, though it runs one direction only. What this page adds is the CGM case, the international unit, and the range around your answer instead of a single tidy figure.
One last thing. This calculator will not diagnose you, it does not apply cleanly to pregnancy or children (the ADAG study excluded both), and it cannot see your iron levels or how long your red cells happen to live. If your result surprised you, the useful next step is a repeat lab test, not a second calculator. Expect that retest about three months out, because A1C moves on a 35-day half-life and needs the time to catch up. Blood pressure tends to travel with blood sugar, so our mean arterial pressure calculator is a sensible companion check while you wait for it.
This calculator is for informational constitute medical advice or diagnosis. Always consult a qualified healthcare professional.
Frequently Asked Questions
An average of 140 mg/dL works out to an estimated A1C of about 6.5%, which sits right at the diabetes threshold. If that 140 came from a CGM rather than a meter, use GMI instead, which puts it nearer 6.7%. Neither figure diagnoses anything on its own.
Not a public one, and be wary of tools that claim otherwise. No correction factor for iron deficiency or hemolytic anemia has been validated for general use. The 2026 GDAC study built a personalised adjustment, but it needs weeks of your own CGM and lab data.
An average glucose of 155 mg/dL converts to an A1C of roughly 7.0%, the standard ADA goal for most non-pregnant adults with diabetes. It is also the crossover point where the ADAG equation and GMI agree, so both methods return the same answer there.
They measure different things. Your CGM reports GMI, calculated from sensor glucose over about 14 days. Your lab A1C reflects glycation on red blood cells over roughly three months. In the study that defined GMI, the two differed by 0.3 points or more 51% of the time.
Use the NGSP master equation: NGSP % = 0.09148 × IFCC + 2.152. Rearranged, mmol/mol = (A1C% − 2.152) ÷ 0.09148. So 6.5% becomes 48 mmol/mol and 7.0% becomes 53. Most countries outside the United States report A1C in mmol/mol.
Roughly, though expect it to read low. Most people test before meals and miss the after-meal peaks, which drags the average down. The ADAG study used about 2,700 readings per person. A few morning checks is not the same thing.
The ADA sets a general goal of below 7.0% for most non-pregnant adults with diabetes, and below 5.7% is the normal range. Targets are individualised, though. Older adults and people who get low blood sugar frequently are often given a higher one, so ask your doctor for yours.
Sources
Every figure on this page is drawn from government health statistics or peer-reviewed research. Last verified September 2026.