Dr. Farah Taqueer is a pediatrician based in Karachi with more than 14 years of clinical experience. She qualified with an MBBS from Liaquat University of Medical and Health Sciences and holds an MD in Pediatrics, and is registered with...
Most adults should aim for 1.2 to 1.6 grams of protein per kilogram of body weight a day. That's the range in the new 2025–2030 Dietary Guidelines. Our protein calculator turns it into your own number in grams, adjusts it for how active you are, your goal and your age, and then splits it across your meals. Just fill in the boxes above. It takes about ten seconds.
You've probably seen 0.8 g/kg quoted as the daily target. That's the RDA, and it's a minimum. It's the amount that keeps almost every healthy adult from running short, not the amount most people feel and do their best on.
How the Protein Calculator Works
The math is simple. You multiply your weight by a protein rate:
Protein (g/day) = body weight (kg) × your protein rate (g/kg)
If you enter pounds, the tool changes them to kilograms first (1 lb = 0.4536 kg). Your activity level picks your starting rate, and your goal moves it up a little:
Activity level
Maintain
Lose weight / cut
Build muscle / bulk
Sedentary
1.20 g/kg
1.26 g/kg
1.38 g/kg
Lightly active
1.40 g/kg
1.47 g/kg
1.61 g/kg
Moderately active
1.60 g/kg
1.68 g/kg
1.84 g/kg
Very active
1.80 g/kg
1.89 g/kg
2.07 g/kg
Extremely active
2.00 g/kg
2.10 g/kg
2.20 g/kg
Picking Lose Weight adds 5% to your rate, and it never goes below 1.2. Picking Build Muscle adds 15%, but it stops at 2.2 g/kg. That limit comes from research. A large review of 49 strength training studies found that, on average, extra protein stopped adding more muscle at around 1.6 g/kg. Its authors suggested aiming for about 2.2 g/kg if you want to be sure you're getting the most out of your training, because 2.2 was the top of their likely range.
The tool also does two things on its own. If you're 65 or older, your rate never goes below 1.3 g/kg. That's our own choice, picked to sit inside the 1.2 to 1.5 g/kg range the Nordic Nutrition Recommendations 2023 give older adults. And the Min and Max cards under your result are 0.8 and 2.2 times your weight (your adjusted weight if your BMI is over 30). Think of them as the bare minimum and the top of what research supports.
Worked example: 75 kg, moderately active, maintaining. 75 × 1.6 = 120 g a day, which the tool splits into 40 g over three meals or 30 g over four. Your Min to Max range is 60 to 165 g. Put in 165 lb instead and you get the same 120 g, since 165 lb is 74.8 kg.
Example: 150 lb Woman Losing Weight
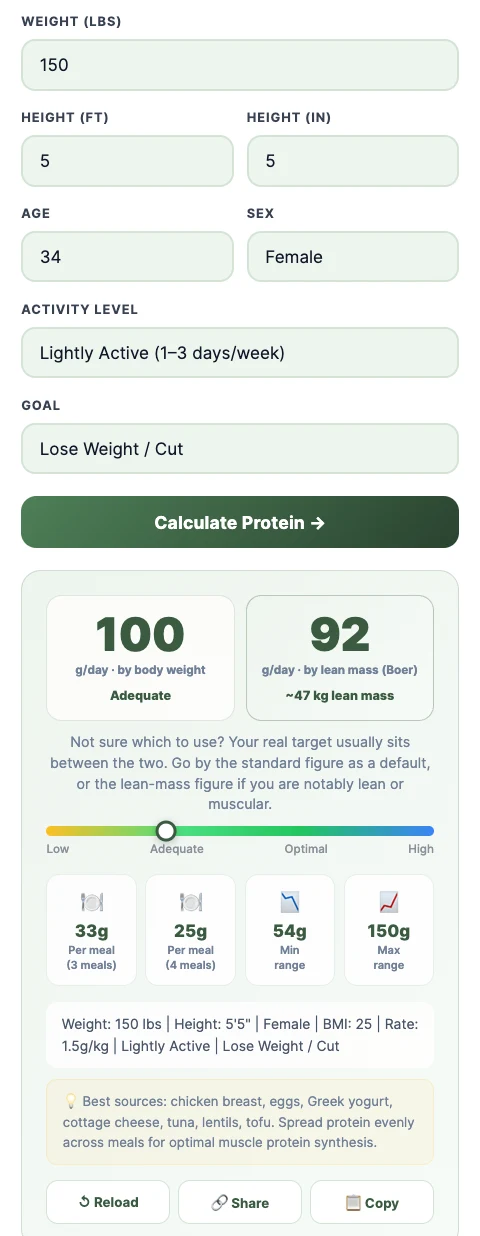
On November 4, 2026, we ran a sample person through the live calculator. She's made up for this example: 34 years old, 5 ft 5 in, 150 lb, works out one to three days a week (Lightly Active), and wants to lose weight.
This is what came back:
100 g a day by body weight, in the Adequate band (rate 1.47 g/kg)
92 g a day by lean mass, from an estimated 47 kg of lean tissue
33 g per meal across three meals, or 25 g across four
Min to Max range of 54 to 150 g
So what should she do with it? Go for 92 to 100 g a day, and use 100 as her everyday number. She's eating less to lose weight, and protein is what helps her hold on to muscle while the scale goes down. If she started lifting four or five days a week, she'd move up one activity level, and her target would rise to about 114 g. That's a good trade while dieting.
Body Weight vs Lean Mass: Why You Get Two Numbers
The big number on the left is the standard method: your weight times your rate. If you're not sure which one to follow, follow that one.
The number on the right is based on your lean mass. That means everything in your body that isn't fat: muscle, bone, organs and water. The tool estimates it from your height, weight and sex with the Boer formula from 1984:
Then it multiplies your lean mass by your rate divided by 0.75. The 0.75 is our own step, and it assumes the average person is about three quarters lean. So if you're leaner than average, the right-hand number comes out higher. If you carry more body fat, it comes out lower.
Why show two numbers at all? Because your muscles and organs use protein, and fat barely does. A 2025 advisory from four medical and nutrition groups, written for people on GLP-1 weight-loss drugs, said aiming for about 1.5 g per kg of lean mass is more accurate when you know your body composition.
There's a catch, though. Boer is a guess from height and weight, not a body scan. When a 2022 study tested ten of these formulas against DXA scans (a low-dose X-ray that measures fat and lean tissue) in 1,558 adults aged 60 to 65, two other formulas came closer than Boer. If you've had a real body fat test, put it into our FFMI calculator to check your lean mass, and go with whichever of your two numbers it backs up.
How Much Protein If Your BMI Is Over 30
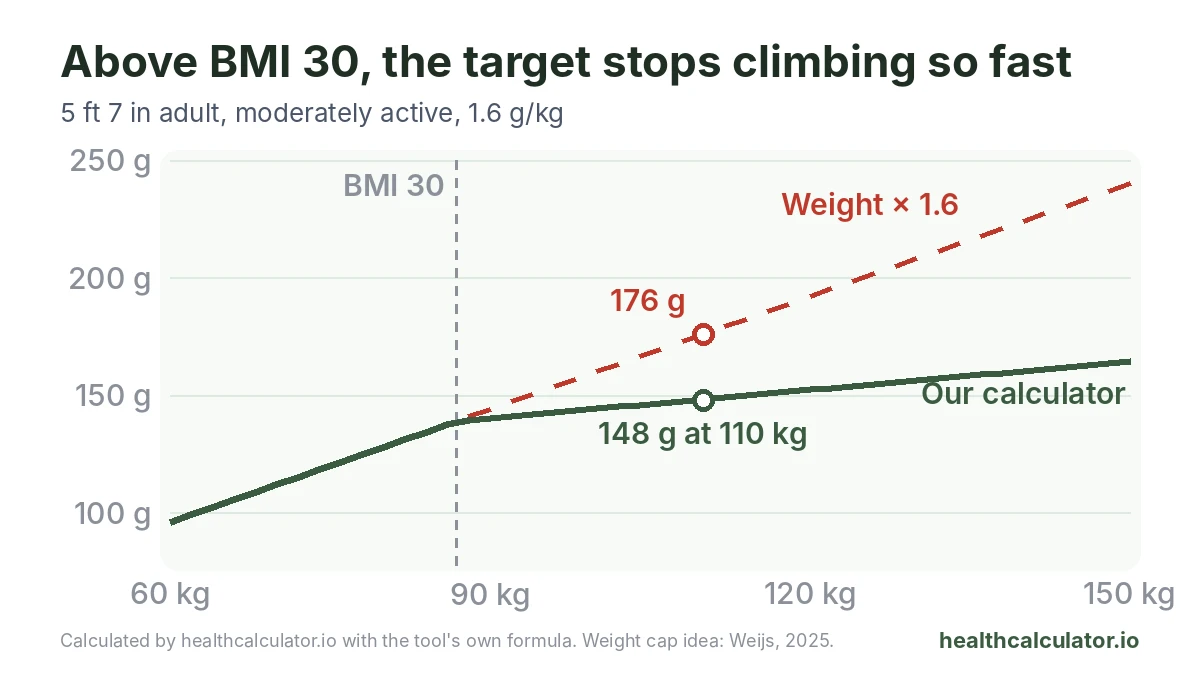
Most calculators skip this part. Take someone who weighs 110 kg. Multiply by 1.6 and you get 176 g of protein a day. But that math treats every extra kilo as if it were muscle. Most of the extra weight above a healthy range is fat, and fat needs very little protein.
The GLP-1 advisory warns that using actual weight can significantly overestimate protein needs in people with obesity. A 2025 review goes a step further and suggests working from your weight capped at a BMI of 30.
So if your BMI is over 30, the calculator uses what you'd weigh at a BMI of 30, then adds back one quarter of the weight above that. Adding that quarter back is our own choice. It's a little more generous than a hard cap, because the same review points out that people who weigh more also tend to carry somewhat more lean tissue.
Worked example: a man who weighs 110 kg at 5 ft 7 in has a BMI of 38. At a BMI of 30 he'd weigh 86.9 kg. A quarter of the 23.1 kg above that is 5.8 kg, so his adjusted weight is 92.7 kg. At 1.6 g/kg the tool gives him 148 g, not 176 g. A hard BMI 30 cap would give 139 g, so the tool lands in between. Not sure what your BMI is? Our BMI calculator will tell you in a few seconds.
See the bend in the green line? Below a BMI of 30, nothing changes. Above it, each extra kilogram adds 0.4 g to your target instead of 1.6 g.
Protein Intake Chart by Body Weight
Just want a quick answer to "I weigh 160 pounds, how much protein do I need?" Find your weight below. Every number was worked out by healthcalculator.io with the same formula the calculator uses: pounds × 0.453592, times the rate for your activity level, rounded to the nearest gram. The chart assumes you're under 65, your BMI is 30 or less, and you want to keep your weight steady. Losing weight adds about 5%, and building muscle adds about 15%.
Body weight
Sedentary (1.2 g/kg)
Lightly active (1.4)
Moderately active (1.6)
Very active (1.8)
110 lb (49.9 kg)
60 g
70 g
80 g
90 g
120 lb (54.4 kg)
65 g
76 g
87 g
98 g
130 lb (59.0 kg)
71 g
83 g
94 g
106 g
140 lb (63.5 kg)
76 g
89 g
102 g
114 g
150 lb (68.0 kg)
82 g
95 g
109 g
122 g
160 lb (72.6 kg)
87 g
102 g
116 g
131 g
170 lb (77.1 kg)
93 g
108 g
123 g
139 g
180 lb (81.6 kg)
98 g
114 g
131 g
147 g
190 lb (86.2 kg)
103 g
121 g
138 g
155 g
200 lb (90.7 kg)
109 g
127 g
145 g
163 g
220 lb (99.8 kg)
120 g
140 g
160 g
180 g
Four of these were checked against the live calculator on November 4, 2026 (120 lb sedentary, 160 lb and 190 lb moderately active, 220 lb very active), and all four matched.
How Much Protein You Need by Goal and Age
Health groups give different numbers, mostly because they're answering different questions. Here's how they compare:
Who
Daily protein
Where it comes from
Any healthy adult, minimum
0.8 g/kg
RDA, National Academies
General adult population
1.2–1.6 g/kg
2025–2030 Dietary Guidelines
Regular exercisers
1.4–2.0 g/kg
International Society of Sports Nutrition
Strength training for muscle
about 1.6, up to 2.2 g/kg
Morton review of 49 studies, 2018
Lifters dieting hard
2.3–3.1 g/kg
International Society of Sports Nutrition
Older adults
1.2–1.5 g/kg
Nordic Nutrition Recommendations 2023
Weight loss with obesity
at least 1.2 g/kg, weight capped at BMI 30
Weijs, 2025
Pregnancy
1.1 g/kg
RDA, National Academies
Breastfeeding
1.3 g/kg
RDA, National Academies
Kidney disease, stages 3 to 5
0.8 g/kg
KDIGO 2024
A couple of things to know. The 2.3 to 3.1 g/kg range is for people who already lift seriously and are dieting hard. The calculator stops at 2.2 g/kg on purpose, since it's built for everyday adults, not competitive lifters. It also isn't built for pregnancy, breastfeeding or anyone under 18, so it won't ask about them. If that's you, use the table above and check with your doctor or midwife.
Taking a GLP-1 medicine like semaglutide (Ozempic, Wegovy) or tirzepatide (Mounjaro, Zepbound)? The advisory says 1.2 to 1.6 g/kg has been suggested while you're losing weight. It also makes a point that's easy to miss: protein on its own probably won't protect your muscle unless you also do strength training. So don't skip the lifting. Our body recomposition calculator can help you plan that side.
Is 30 Grams of Protein Per Meal the Limit?
You may have heard that your body can only use 20 to 30 g of protein at a time, and the rest goes to waste. A 2023 study suggests it's not that simple. After a workout, people who drank 100 g of milk protein had a bigger and longer protein-building response than people who had 25 g. It was still going 12 hours later, when the researchers stopped measuring.
That doesn't mean you should eat all your protein in one sitting. It was one study, with one meal after one workout and one kind of protein. The International Society of Sports Nutrition still suggests spreading protein out every 3 to 4 hours. But it does mean the per-meal numbers in your result are just a handy way to split your total, not a hard limit. If dinner ends up bigger than breakfast, you're not wasting the extra.
What 100 Grams of Protein Looks Like in Food
100 g is easier to hit when you can picture it. Here's how much protein you get from 100 g of everyday foods, using numbers from USDA FoodData Central:
Food (100 g, about 3.5 oz)
Protein
Chicken breast, roasted (meat only)
31.0 g
Tofu, firm (calcium sulfate)
17.3 g
Egg, whole, hard-boiled
12.6 g
Cottage cheese, 2% milkfat
10.4 g
Greek yogurt, plain, nonfat
10.2 g
Lentils, boiled
9.0 g
Chickpeas, boiled
8.9 g
And here's one simple way our 150 lb example could reach her 100 g:
Breakfast: 170 g Greek yogurt = 17.3 g
Lunch: 120 g roasted chicken breast = 37.2 g
Snack: 100 g cottage cheese = 10.4 g
Dinner: 150 g firm tofu plus 100 g boiled lentils = 34.9 g
That's 99.8 g, and that's before counting the bread, rice, oats or vegetables on her plate, which add a few grams more.
Protein and Kidney Disease: When to Eat Less
The calculator can't see your kidneys, so this part is up to you and your doctor. For adults with chronic kidney disease stages 3 to 5, the KDIGO 2024 guideline suggests 0.8 g/kg a day, and says to avoid going over 1.3 g/kg if the disease could get worse. Most of the targets on this page are above that. If you have a recent eGFR result (a blood test that shows how well your kidneys filter), you can see what it means with our GFR calculator. Then talk to your doctor or a kidney dietitian before you eat more protein.
The same goes if you have liver disease or have had kidney stones, if you're pregnant, or if you're under 18.
This calculator is for informational and screening purposes only and does not constitute medical advice or diagnosis. Always consult a qualified healthcare professional.
Common Questions About Protein Intake
Multiply your weight in kilograms by a protein rate. For most adults that rate is 1.2 to 1.6 g/kg, higher if you train hard, so a 70 kg adult lands at 84 to 112 g a day. A protein calculator like the one above converts pounds and adjusts the rate for activity, goal, age and a BMI over 30.
About 84 to 112 g a day under the 2025–2030 Dietary Guidelines range of 1.2 to 1.6 g/kg. In our tool, a sedentary 70 kg adult who wants to maintain gets 84 g, a moderately active one gets 112 g, and a very active one gets 126 g. The RDA minimum would be 56 g.
Not for most healthy adults. 100 g sits inside the 1.2 to 1.6 g/kg guideline range if you weigh roughly 138 to 184 lb, and it stays under the 2.2 g/kg research ceiling if you weigh more than about 100 lb. It's a different story with chronic kidney disease, where much lower limits apply.
For almost everyone, yes. In strength training studies, extra protein stopped adding more muscle at around 1.6 g/kg, so 2 g/kg is already past that point and still under the 2.2 g/kg ceiling. The main exception is experienced lifters dieting hard, where the International Society of Sports Nutrition suggests 2.3 to 3.1 g/kg.
The firm limits apply to people who already have kidney disease. For adults with chronic kidney disease stages 3 to 5, the KDIGO 2024 guideline suggests 0.8 g/kg a day and avoiding more than 1.3 g/kg if the disease could get worse. If you have CKD or a low eGFR, set your target with your doctor, not this tool.
Use your current weight. At a BMI of 30 or under, the tool uses it as is. Above 30, it uses your weight at BMI 30 plus a quarter of the excess, because full scale weight can overestimate protein needs with obesity. That is why a 110 kg, 5 ft 7 in adult gets 148 g, not 176 g.
No. It's built for adults 18 and older who aren't pregnant or breastfeeding, so it doesn't ask about either. The RDA rises to 1.1 g/kg in pregnancy and 1.3 g/kg while breastfeeding. Teens have growth needs that call for pediatric guidance. Ask your doctor for a target in those situations.
Have clinical or research experience with this calculator? If you spot an error in the formula, the thresholds or the sources, or you would like to contribute to this page, write to partnerships@healthcalculator.io.
Sources
Every figure on this page is drawn from government health statistics or peer-reviewed research. Last verified November 2026.
Weijs PJM. Protein requirement in obesity. Current Opinion in Clinical Nutrition and Metabolic Care. 2025;28(1):27-32. doi:10.1097/MCO.0000000000001087.
U.S. Department of Agriculture, Agricultural Research Service. FoodData Central (SR Legacy entries 171477, 172475, 173424, 172182, 170894, 172421, 173757). USDA; accessed November 2026.