
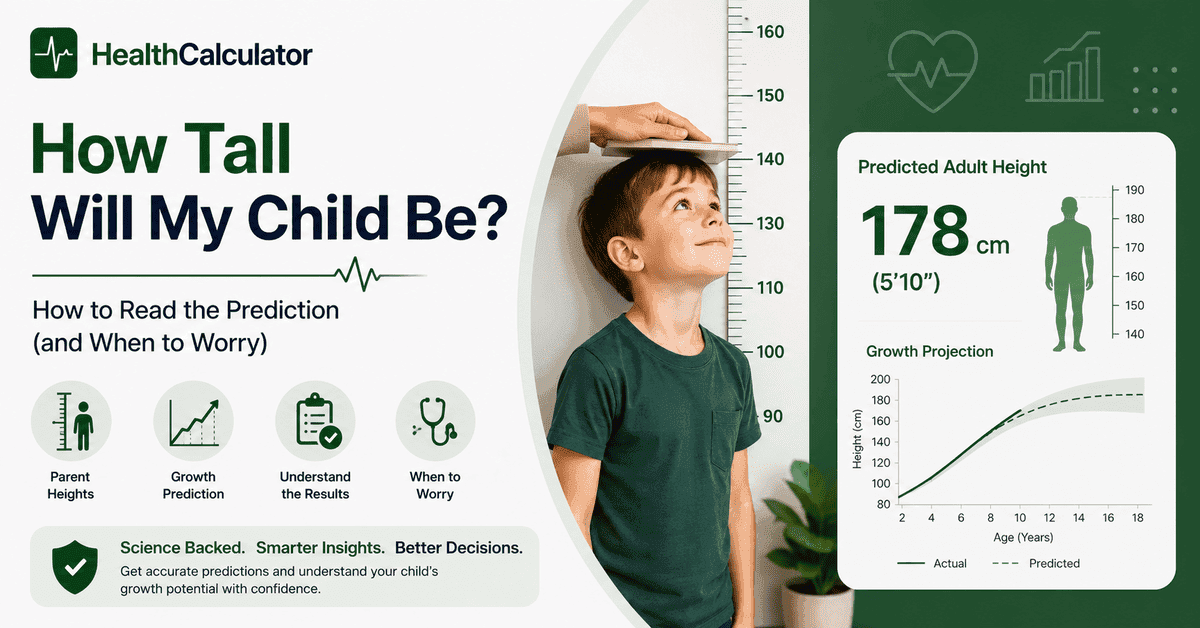
Add both parents’ heights in centimetres, add 13 cm for a son or subtract 13 cm for a daughter, then divide by two. That is your child’s target height. It is a real number with a real limit: in a 2024 study of 303 adult children, mid parental height explained 36% of the variance in how tall they actually finished. The other 64% is the part worth understanding.
Enter both parents’ heights. Works even before a baby is born.
So the formula is not wrong. It is just partial, and most pages that hand it to you stop at the arithmetic.
I built the height calculator on this site, which means I have spent a lot of time inside the equations rather than just quoting them. This guide is what I learned. It covers what the number can tell you, the one situation where it quietly misleads parents, and how to read the gap that actually matters.
What mid parental height actually explains, and what it does not
That 2024 paper is worth sitting with, because it is the most careful look at this formula anyone has published recently. Researchers measured the final heights of 303 children and both parents across 23 large families, some with sixteen adult children in one household. Perfect conditions for testing a family formula.
Two things fell out.
First, the 36%. Height is strongly heritable, and the same study put heritability of height at 74%. So the parent formula is capturing about half of the genetic signal that is actually there, and none of the rest.
Second, and more usefully: the standard formula runs low. Children finished on average 2.7 cm taller than their mid-parental height predicted. That is not noise. It is a consistent bias, and once the researchers corrected for age, sex scaling and regression to the mean, they pushed that bias down to 0.14 cm and lifted variance explained to 40%.
Here is the part that gives you scale. The largest height genetics study ever run analysed 5.4 million people and mapped 12,111 independent DNA variants. Those variants explain 40% of height variance in people of European ancestry, and only 10 to 20% in everyone else.
Read that again. Two parents and a tape measure get you 36%. Twelve thousand genetic markers from five million people get you 40%.
The formula is not the weak link. Predicting a human being is just hard.
Measure the parents. Please do not guess
This is the single cheapest accuracy upgrade available to you, and almost nobody does it.
A pediatric endocrinology clinic quietly measured 315 parents who had just been asked to state their own height. The parents did not know they were in a study. Fathers reported themselves at 174.9 cm and measured 173.2 cm, a mean overestimate of 1.7 cm. Only 50% of fathers and 58% of mothers landed within 2 cm of their real height.
Then it gets worse. When mothers were asked to report the father's height, the average came out at 177 cm, a full 3.8 cm above what those fathers actually measured.
The knock-on effect on the target height was measurable. Only 70% of target heights calculated from reported parent heights landed within 2 cm of the version calculated from measured heights. Individual errors ran from 7.9 cm too low to 9.8 cm too high.
How to measure properly: shoes off, heels and bottom and shoulders flat against a wall, eyes looking straight ahead, and mark at the crown with something rigid. Same time of day each time. You are genuinely taller in the morning.
Two minutes. It moves your answer more than any formula choice you will make.
Find your two heights in this table
Because the most common version of this question is not abstract. It is "my husband is 5'10", I'm 5'5", so what does that make our kids?"
For that exact pair: a son lands at 178 cm (5'10"), a daughter at 165 cm (5'5").
Target height for a SON (mother's height across the top, father's down the side)
| Father ↓ / Mother → | 5'0" | 5'2" | 5'3" | 5'4" | 5'5" | 5'6" | 5'7" |
|---|---|---|---|---|---|---|---|
| 5'6" | 166 cm / 5'5" | 169 cm / 5'6" | 170 cm / 5'7" | 172 cm / 5'8" | 173 cm / 5'8" | 174 cm / 5'9" | 176 cm / 5'9" |
| 5'8" | 169 cm / 5'6" | 172 cm / 5'8" | 173 cm / 5'8" | 174 cm / 5'9" | 176 cm / 5'9" | 177 cm / 5'10" | 178 cm / 5'10" |
| 5'10" | 172 cm / 5'8" | 174 cm / 5'9" | 176 cm / 5'9" | 177 cm / 5'10" | 178 cm / 5'10" | 180 cm / 5'11" | 180 cm / 5'11" |
| 6'0" | 174 cm / 5'9" | 176 cm / 5'9" | 178 cm / 5'10" | 180 cm / 5'11" | 180 cm / 5'11" | 182 cm / 5'11" | 183 cm / 6'0" |
| 6'1" | 175 cm / 5'9" | 178 cm / 5'10" | 179 cm / 5'10" | 180 cm / 5'11" | 182 cm / 5'11" | 183 cm / 6'0" | 184 cm / 6'0" |
Target height for a DAUGHTER
| Father ↓ / Mother → | 5'0" | 5'2" | 5'3" | 5'4" | 5'5" | 5'6" | 5'7" |
|---|---|---|---|---|---|---|---|
| 5'6" | 154 cm / 5'0" | 156 cm / 5'1" | 158 cm / 5'2" | 159 cm / 5'3" | 160 cm / 5'3" | 162 cm / 5'4" | 162 cm / 5'4" |
| 5'8" | 156 cm / 5'1" | 158 cm / 5'2" | 160 cm / 5'3" | 162 cm / 5'4" | 162 cm / 5'4" | 164 cm / 5'5" | 165 cm / 5'5" |
| 5'10" | 158 cm / 5'2" | 161 cm / 5'3" | 162 cm / 5'4" | 164 cm / 5'5" | 165 cm / 5'5" | 166 cm / 5'6" | 168 cm / 5'6" |
| 6'0" | 161 cm / 5'3" | 164 cm / 5'4" | 165 cm / 5'5" | 166 cm / 5'6" | 168 cm / 5'6" | 169 cm / 5'7" | 170 cm / 5'7" |
| 6'1" | 162 cm / 5'4" | 164 cm / 5'5" | 166 cm / 5'5" | 168 cm / 5'6" | 168 cm / 5'6" | 170 cm / 5'7" | 171 cm / 5'7" |
Every cell carries roughly a ±8.5 cm band around it. For context on where these numbers sit, US adults measured in the 2021 to 2023 national survey averaged 68.9 inches for men and 63.5 inches for women, which is 175.0 cm and 161.3 cm.
Your height matters less than you think. Here is exactly how much less
Now for the part I could not find anywhere else, so I worked it out.
The Khamis-Roche method is the better predictor, because it uses your child's own age, height and weight alongside your heights. It comes from a 1994 Pediatrics paper built on the Fels Longitudinal Study in Ohio. It is a regression equation with published coefficients, which means you can take it apart and ask a question the equation can answer but nobody bothers to ask:
When the model makes its prediction, how much of it is coming from you, and how much from your child?
I ran the published coefficients across every age in the model, holding a 50th-percentile child steady and nudging one input at a time. Each column below is centimetres of change in the predicted adult height.
| Child's age | Boys: +1 cm of one parent | Boys: +1 cm of the child | Child outweighs parent by | Girls: +1 cm of one parent | Girls: +1 cm of the child | Child outweighs parent by |
|---|---|---|---|---|---|---|
| 4 | 0.25 cm | 1.24 cm | 4.9x | 0.22 cm | 1.25 cm | 5.6x |
| 6 | 0.26 cm | 1.06 cm | 4.0x | 0.17 cm | 1.16 cm | 6.8x |
| 8 | 0.22 cm | 1.07 cm | 4.8x | 0.16 cm | 1.05 cm | 6.7x |
| 10 | 0.23 cm | 0.97 cm | 4.2x | 0.19 cm | 0.83 cm | 4.4x |
| 12 | 0.30 cm | 0.68 cm | 2.2x | 0.20 cm | 0.64 cm | 3.3x |
| 14 | 0.29 cm | 0.59 cm | 2.0x | 0.10 cm | 0.85 cm | 8.4x |
| 16 | 0.17 cm | 0.75 cm | 4.4x | 0.02 cm | 1.03 cm | 63.3x |
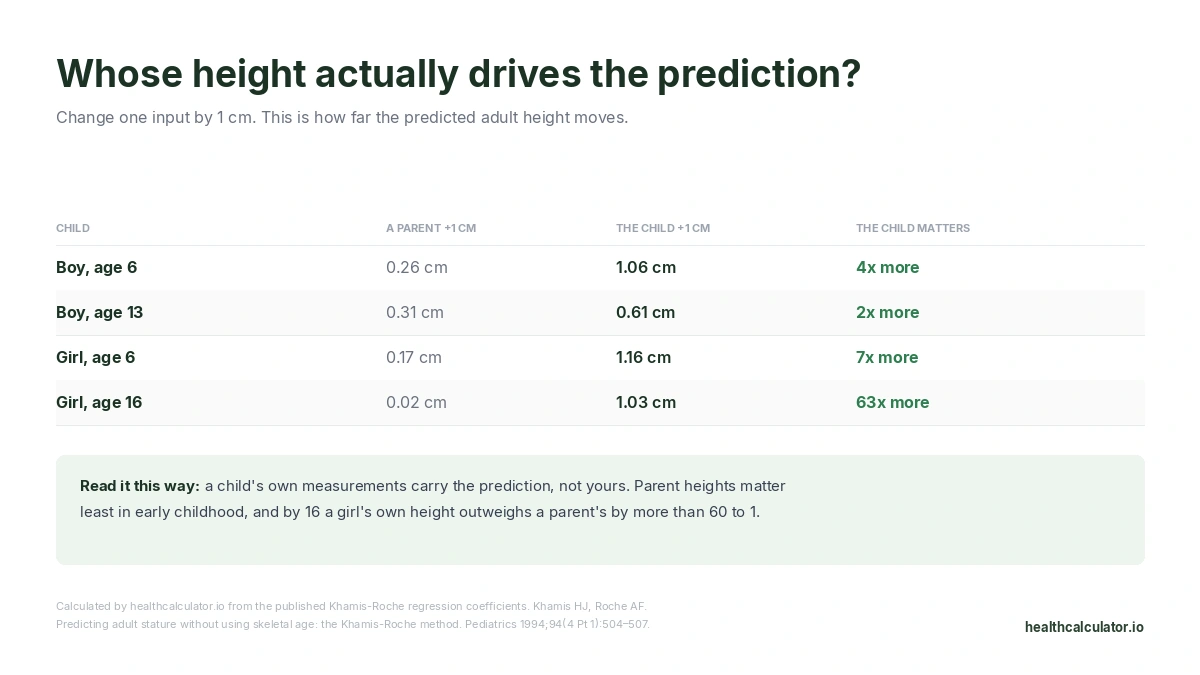
Three things jump out of that table.
Your child's own body outweighs yours at every single age. By four to seven times through primary school. Every article that frames height as "look at the parents" has the emphasis backwards.
Parental influence peaks in early adolescence and then falls off a cliff. For boys it tops out around age 13. For girls it collapses after 12, and by 16 the model has essentially stopped listening to you. That is not a flaw. A sixteen-year-old girl has already spent her genetics, and her measured height is now the better evidence.
This is why the fuller method forgives a bad parent measurement. Take that mother-reported father height, off by 3.8 cm. In the mid-parental formula that shifts the target by 1.9 cm. In Khamis-Roche at age 10, it shifts the prediction by 0.7 to 0.9 cm. Less than half the damage.
One honest caveat on the same model, since I am showing you its guts. The weight coefficient is strongly negative in young children, so at age 4 a girl who is 5 kg heavier than average gets a prediction 5.4 cm shorter. By age 14 that penalty has shrunk to 0.7 cm. Do not over-read a low number for a sturdy toddler. The model was not built to comment on your four-year-old's build.
The real problem: the formula reassures you about exactly the wrong children
This is the finding I most want you to leave with, and I have not seen a single competing page mention it.
In 1999, two researchers compared 419 representatively sampled children aged 8 to 9 against their mid-parental heights. The headline was reassuring: 90% of children landed within about two centile spaces of their mid-parental height. The formula works.
Then they looked at the 13 children who were genuinely short, below the 2nd centile. Using the standard formula, eight of those 13 looked fine. Within family range. Nothing to see.
Then they applied the regression-to-the-mean correction, which accounts for the fact that very short parents tend to have children who are relatively less short. Suddenly only three of the 13 were within range.
Five short children flipped from "normal for this family" to "worth investigating" the moment the correction was applied.
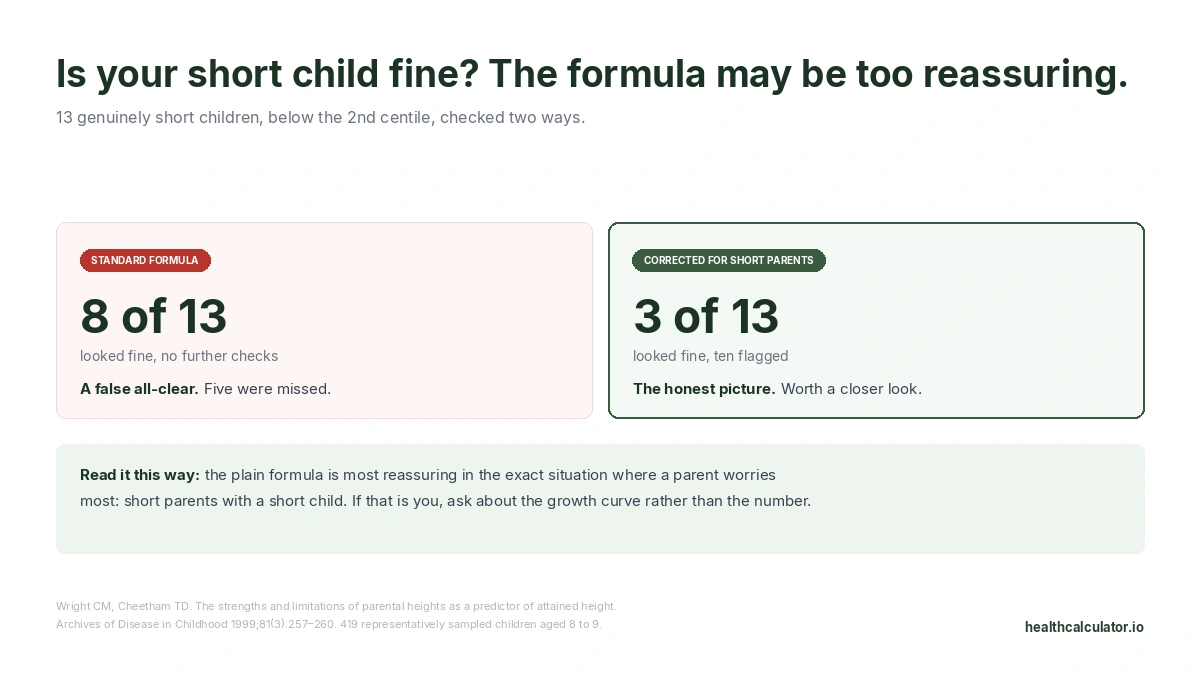
Sit with what that means. The standard formula, the one on every calculator page including the simple one on mine, is systematically most generous in the exact scenario where a parent is most worried. Short parents, short child, formula says relax. The authors put it plainly: mid-parental height is useful for families of average stature, and can be misleading when used to assess short children.
So if your family is short and your child is short and the calculator told you everything is fine, that is the one result on the internet you should be least willing to accept without a pediatrician looking at the growth curve.
WebMD is one of the few tools that says something similar in its own fine print, noting estimates are less accurate when parent heights are far from average and for children who are short for their age. Credit where it is due.
How the main height predictors actually compare
Since you have probably clicked three of these already, here is an honest side-by-side. I opened every one of these tools to check what it does and what it claims.
| Tool | Method | Inputs it uses | Stated accuracy | Warns about short children? |
|---|---|---|---|---|
| healthcalculator.io | Khamis-Roche + Tanner mid-parental | Age, sex, height, weight, both parents | Range shown with every result | Yes, in this guide |
| Calculator.net | Khamis-Roche | Age, sex, height, weight, parents | "Not an exact science"; notes the method suits white children aged 4 to 9 | Partly |
| Omni Calculator | Khamis-Roche + mid-parental | Age, sex, height, weight, parents | Quotes ±2.1 in for boys, ±1.7 in for girls | No |
| WebMD | Mid-parental only | Both parents, sex | "Usually within 4 inches" | Yes, explicitly |
| AAP / HealthyChildren | Mid-parental, 2.5 inch variant | Both parents, sex | "About four inches up or down" | Says bone age is the most accurate method |
| Mayo Clinic | Mid-parental + doubling rule | Both parents | "No sure way to tell" | No |
One note that trips people up constantly. The AAP averages the two parents first and then adds or subtracts 2.5 inches. Mayo adds or subtracts 5 inches and then divides. These are the same formula. 5 inches before the division equals 2.5 inches after it. If two calculators gave you the same answer by different routes, nothing is broken.
What "accurate" actually means here, since you asked
A lot of people search for a 100 percent accurate height predictor. I want to be straight with you: it does not exist, and the ceiling is lower than you would guess.
Take the most sophisticated attempt published so far. A 2026 study in World Journal of Pediatrics built a model for girls at menarche using hand and wrist bone age, plus machine-extracted radiomic features from knee X-rays, plus height at menarche, plus father's height. Two X-rays and a texture-analysis algorithm.
Its 95% limits of agreement were minus 3.96 to plus 3.93 cm. About 4 cm either way. That is the current state of the art, and it beat the traditional Greulich-Pyle and Bayley-Pinneau bone-age methods, which the authors describe as showing limited accuracy.
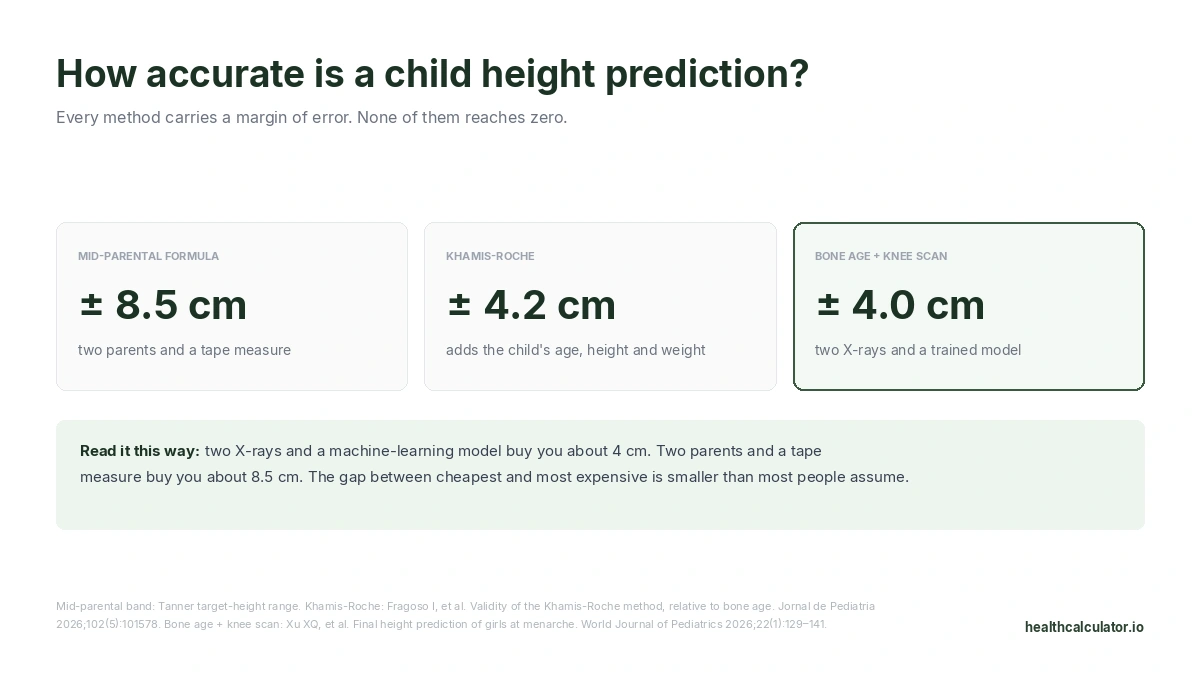
So: two radiographs and a machine-learning model buy you roughly ±4 cm. A tape measure and two parents buy you roughly ±8.5 cm. The gap between the cheapest method and the most expensive one is smaller than most people assume.
There is one real bargain in the middle. A 2026 validation in Portuguese children aged 11 to 15 compared Khamis-Roche against predictions made from actual bone age. Mean difference: 0.2 ± 4.2 cm in boys, 0.6 ± 3.1 cm in girls, with agreement above 0.91. Worth being precise about what that shows: it means Khamis-Roche lands close to what an X-ray-based prediction would have said, not that either one is accurate to 4 cm against the child's real adult height. Still, it is a good reason to skip the radiation for a routine question.
When the number gets sharper
Reliability climbs with age, and it jumps once puberty is underway, because you stop guessing about timing and start observing it.
The pattern in the sensitivity table above is the mechanism. Early on, the model leans on your heights because your child has not revealed much yet. As they grow, their own trajectory takes over.
Past menarche the picture tightens further, and there is a genuinely interesting population difference here. In a prospective study of 534 Chilean girls followed for four years after their first period, average total growth was 6.6 ± 2.5 cm, with 3.8 ± 1.5 cm arriving in the first year alone. Timing mattered a lot: girls whose menarche came before 11 gained 8.2 ± 3.2 cm, while those starting after 13 gained only 4.4 ± 1.6 cm.
But in that Chinese cohort from the 2026 study, post-menarche gain averaged 8.94 ± 2.99 cm. Same life stage, meaningfully different number.
Which is a good reminder that all of these models carry the population they were built on. Khamis-Roche came from 223 white boys and 210 white girls in Ohio, and the original paper says outright that its applicability is limited to white American children. That does not make it useless elsewhere. It does mean the error band around your result is probably wider than the one printed on the screen.
The shortcuts that do not work
Doubling your child's height at age 2. You will see this everywhere, including inside Google's own AI answers. The American Academy of Pediatrics describes it and then adds that no research exists to demonstrate its accuracy. It is folklore with a number attached.
Shoe size, hand size, and the "signs of a tall child" lists. No published evidence supports any of them as adult-height predictors.
Judging from one measurement. A single data point cannot show a trend, and the trend is the whole game. The CDC is explicit that growth charts are not a sole diagnostic instrument, and uses WHO standards below age 2 and CDC charts from 2 upward.
When to actually call the pediatrician
Not because the number came out low. Because of the shape of the line.
- Your child crosses downward through percentile lines instead of tracking steadily along one. This is the big one.
- Projected height sits roughly 8 to 10 cm or more below the target height from your measurements.
- Height is below the 3rd percentile, and especially if the family is short, since that is the blind spot described above.
- Growth slows or stalls before puberty starts.
- Puberty arrives conspicuously early or late.
- One sibling diverges sharply from the others with no family explanation.
A child sitting steadily on the 5th percentile is usually just a small child. A child sliding from the 50th to the 10th is telling you something, and the AAP is blunt about timing: once puberty finishes, growth stops, and a short teenager has little or no time left to catch up.
If you want to run the fuller Khamis-Roche version with your child's own measurements, the height calculator does both methods side by side and shows you the gap between them. You will need your child's exact age in years and months, and the chronological age calculator will work that out to the decimal if you want to be precise about it.
Measure the parents first, though. Everything downstream depends on it.
This article is for informational purposes only and does not constitute medical advice or diagnosis. Height predictions are statistical estimates carrying a wide margin of error, and a result outside the expected range is not a diagnosis of anything. Always consult a qualified healthcare professional about concerns regarding your child's growth.
Frequently Asked Questions
Measure both parents, add the two heights, then add 13 cm for a son or subtract 13 cm for a daughter and divide by two. That is the target height. For a sharper estimate, use the Khamis-Roche method, which adds your child's own age, height and weight to the calculation.
A son's target height is 178 cm, or 5 feet 10 inches. A daughter's is 165 cm, or 5 feet 5 inches. Both carry roughly a ±8.5 cm band, so the realistic range for that son is about 169 to 186 cm and for that daughter about 156 to 173 cm.
Accuracy climbs steadily and jumps once puberty starts, so roughly age 12 to 14 is where estimates become genuinely useful. Running the published Khamis-Roche coefficients shows why: by age 16 a girl's own measured height moves the prediction more than 60 times as much as a parent's height does.
Tall parents and a child tracking steadily along a high percentile line are the only two signals with real evidence behind them. Shoe size, hand size and long limbs in toddlerhood are not validated predictors. Later puberty also tends to mean more growing time, which often adds height.
No. The most advanced published model, which combines hand and wrist bone age with knee radiomic analysis, still had 95% limits of agreement of about 4 cm either way. Any tool promising exact numbers from parent heights alone is overselling what the science supports.
Yes, and better than you might expect. Plot your child's height on the growth chart and follow their percentile forward to adulthood. Since a child's own measurements outweigh a parent's by four to seven times in the Khamis-Roche model, this works well for adopted children and unknown parentage.
Target height for a girl is (mother's height + father's height − 13 cm) ÷ 2, in centimetres. In inches, subtract 5 before dividing. The AAP version averages the parents first and subtracts 2.5 inches, which gives the same answer.
The standard formula runs low. Across 303 adult children, final heights averaged 2.7 cm above the mid-parental prediction. Regression to the mean adds to this, pulling children of unusually short parents upward toward the population average.
Sources
Every figure on this page is drawn from government health statistics or peer-reviewed research. Last verified September 2026.
- Zeevi D, Ben Yehuda A, Nathan D, Zangen D, Kruglyak L. Accurate Prediction of Children's Target Height from Their Mid-Parental Height. Children (Basel). 2024;11(8):916. doi:10.3390/children11080916.
- Yengo L, Vedantam S, Marouli E, et al. A saturated map of common genetic variants associated with human height. Nature. 2022;610(7933):704–712. doi:10.1038/s41586-022-05275-y.
- Braziuniene I, Wilson TA, Lane AH. Accuracy of self-reported height measurements in parents and its effect on mid-parental target height calculation. BMC Endocrine Disorders. 2007;7:2. doi:10.1186/1472-6823-7-2.
- National Center for Health Statistics. Body Measurements. Centers for Disease Control and Prevention; National Health and Nutrition Examination Survey, August 2021–August 2023.
- Khamis HJ, Roche AF. Predicting adult stature without using skeletal age: the Khamis-Roche method. Pediatrics. 1994;94(4 Pt 1):504–507.
- Wright CM, Cheetham TD. The strengths and limitations of parental heights as a predictor of attained height. Archives of Disease in Childhood. 1999;81(3):257–260. doi:10.1136/adc.81.3.257.
- WebMD. Children's Height Predictor. WebMD LLC.
- Calculator.net. Height Calculator.
- Omni Calculator. Height Calculator & Height Predictor.
- American Academy of Pediatrics. Predicting a Child's Adult Height. HealthyChildren.org.
- Mayo Clinic Staff. Child growth: Can you predict adult height? Mayo Foundation for Medical Education and Research; reviewed January 25, 2025.
- Xu XQ, Chen Y, Wang YR, et al. Final height prediction of girls at menarche: a combined model using left hand and wrist bone age, knee radiomic scores, and clinical characteristics. World Journal of Pediatrics. 2026;22(1):129–141. doi:10.1007/s12519-025-01002-5.
- Fragoso I, Albuquerque J, Teles J, et al. Validity of the Khamis-Roche method, relative to bone age, in Portuguese children and adolescents from 11 to 15 years. Jornal de Pediatria. 2026;102(5):101578. doi:10.1016/j.jped.2026.101578.
- Gaete X, Ferrer-Rosende P, Pereira A, Mericq V. Post-Menarcheal Growth Patterns in a Contemporary Cohort of Latino Girls. Hormone Research in Paediatrics. 2025;98(1):66–74. doi:10.1159/000536506.
- National Center for Health Statistics. Growth Charts. Centers for Disease Control and Prevention; reviewed September 2, 2024.