
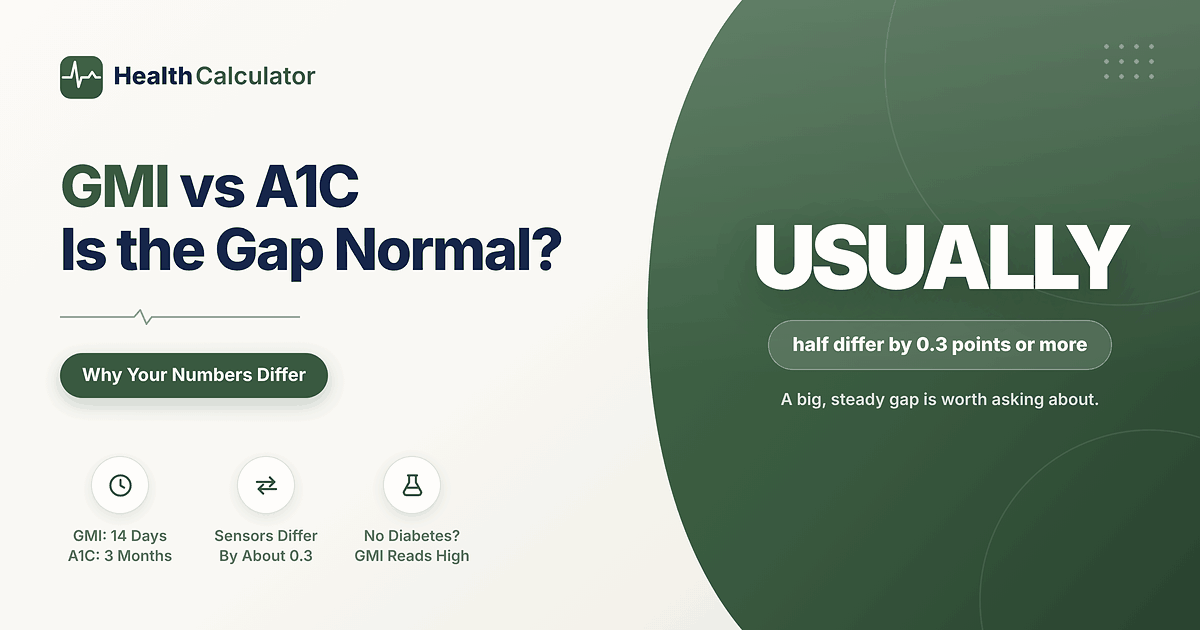
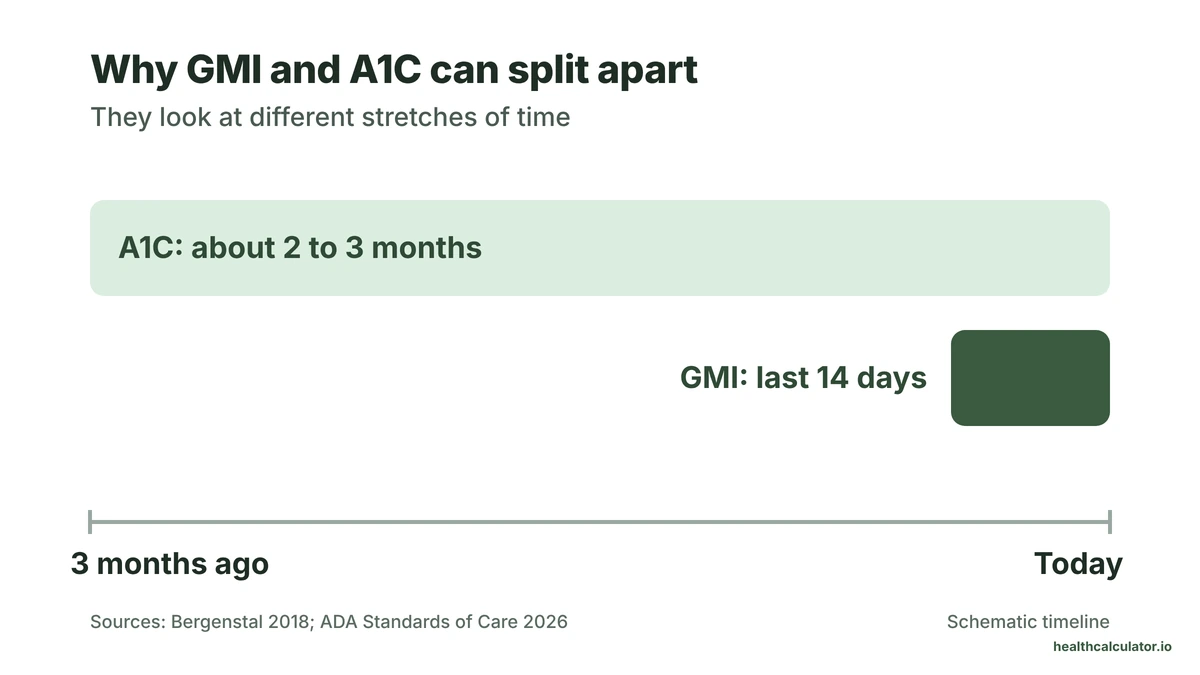
GMI is your CGM’s estimate of A1C, based on at least 14 days of average glucose. A1C is a lab test of the sugar stuck to your red blood cells over about 2 to 3 months. When GMI was created, the two differed by 0.3 points or more half the time, so a GMI vs A1C mismatch is normal.
So if your app says 7.3% and your lab says 6.8%, nothing is broken. You’re looking at two different measurements, and your own gap between them can actually be useful.
GMI vs A1C: What’s the Difference?
GMI stands for glucose management indicator. It isn’t measured. It’s calculated from one number, your average CGM glucose, using the GMI formula:
GMI (%) = 3.31 + 0.02392 × average glucose (mg/dL)
That line came from 528 people with diabetes in four trials who wore a Dexcom G4 sensor and also had a lab A1C. Before 2018, apps called this number “estimated A1C.” The FDA’s device division raised concerns that “estimated A1C” made it sound closer to the lab test than it really is, so the field renamed it GMI.
Here’s how the two compare side by side:
| Feature | GMI | A1C |
|---|---|---|
| Where it comes from | Your CGM average, run through a formula | A blood sample tested in a lab |
| What it reflects | The last 14 days or so | About 2 to 3 months |
| What it actually measures | Sugar in the fluid under your skin | Sugar stuck to hemoglobin in red blood cells |
| Affected by red cell lifespan | No | Yes |
| Can diagnose diabetes | No | Yes, in an NGSP-certified lab |
| Official target | None set | Under 7% for many adults |
That last row matters. The ADA’s 2026 Standards of Care list GMI as a value approximating A1C, “not always equivalent,” and say goals for it aren’t standardized. The A1C goal of under 7% is for the lab test, and the CGM goal next to it is time in range above 70%.
If you only want the number, the GMI calculator turns your GMI or CGM average into the lab A1C you’re likely to see.”
How Far Apart Are GMI and A1C Usually?
Further than most people expect. Here’s what the original 2018 data showed for 528 people who had both numbers at the same time:
| Gap between GMI and lab A1C | Share of people |
|---|---|
| Less than 0.1 points | 19% |
| 0.3 points or more | 51% |
| 0.5 points or more | 28% |
| 1.0 point or more | 3% |
Later studies found even bigger gaps. A 2024 review in Diabetes Care pulled together 22 groups from different studies and found that 26% to 68% of people had a gap of 0.5 points or more. The highest share was in people with kidney disease.
Even the sensor matters. In that same review, 176 adults with type 2 diabetes wore an Abbott and a Dexcom sensor at the same time. The two GMIs typically disagreed by about 0.3 points, and 26% of people had a difference of 0.5 points or more. Switch brands and your GMI can move without anything in your body changing.
Why your GMI can be higher than your A1C
A recent rough patch shows up in GMI first. Illness, a course of steroids or a few weeks of high readings push your 14-day average up fast, while A1C still carries the calmer months before. The authors of the GMI paper give this exact example.
Why your A1C can be higher than your GMI
It works the other way too. Start a lower-carb diet, a hard exercise plan or a new medicine that works, and your GMI drops quickly. Your A1C takes longer to follow because older red blood cells still carry the sugar they picked up before.
When the gap is about you, not the timing
Some people’s gap stays put even when nothing has changed. Red blood cells live for slightly different lengths of time in different people, and sugar sticks to hemoglobin a bit differently too. Conditions that shorten red cell life, like hemolytic anemia, or hemoglobin variants can push the lab A1C off. The ADA adds a few more causes: big swings in glucose, an inaccurate sensor, or an inaccurate A1C.
Original vs Updated GMI: How Far Apart They Are
In August 2026, the team that created GMI published an updated GMI in Diabetologia. They tested it on 18,860 people with 26,647 pairs of average glucose and lab A1C. The old line runs too high when A1C is low and too low when A1C is high. The update adds red blood cell factors and cut the typical miss at A1C levels under 5.5% or above 9.0% from more than 0.4 points to 0.1 points or less. It worked the same on Abbott Libre and Dexcom data.
CGM apps still show the original GMI, and so does our calculator, because that’s the number on your report. Here’s how far apart the two get:
| Average CGM glucose (mg/dL) | Average glucose (mmol/L) | GMI your app shows (%) | Updated GMI, 2026 (%) |
|---|---|---|---|
| 100 | 5.5 | 5.7 | 5.1 |
| 110 | 6.1 | 5.9 | 5.5 |
| 120 | 6.7 | 6.2 | 5.9 |
| 130 | 7.2 | 6.4 | 6.2 |
| 140 | 7.8 | 6.7 | 6.6 |
| 154 | 8.5 | 7.0 | 7.0 |
| 160 | 8.9 | 7.1 | 7.2 |
| 180 | 10.0 | 7.6 | 7.8 |
| 200 | 11.1 | 8.1 | 8.4 |
| 220 | 12.2 | 8.6 | 8.9 |
| 250 | 13.9 | 9.3 | 9.6 |
How this was made: healthcalculator.io ran each average through the GMI formula our calculator uses, rounded to one decimal. The updated GMI column uses the published mmol/mol equation, [1 ÷ (0.07808 ÷ average in mmol/L + 0.003889)] − 23.497, converted to % with the NGSP master equation. These are calculations from formulas, not data about real people.
Two things jump out. The lines meet near 150 mg/dL, so if your average sits around there, the update changes almost nothing. Below about 140 mg/dL, the GMI your app shows sits above the updated GMI, so it likely overstates your A1C a little. That matters most if you don’t have diabetes (see the wellness CGM section below). Above about 180 mg/dL it sits below the updated GMI, so a lab A1C higher than your GMI is more likely there.
The original GMI also tends to show less of an improvement than your lab will. In a 2025 study of 356 people with type 1 diabetes, those who started with an A1C above 9% saw their A1C fall about twice as much as their GMI over 3 months (a median drop of 1.2 points versus 0.6). If your GMI barely moved but you’ve worked hard, wait for the lab result before you judge.
Example: Running a 165 mg/dL CGM Average Through Our Calculator
On November 10, 2026, I entered a CGM average of 165 mg/dL into the CGM → GMI mode of our A1C calculator. These are example numbers, not a real person’s report. Here’s what came back:
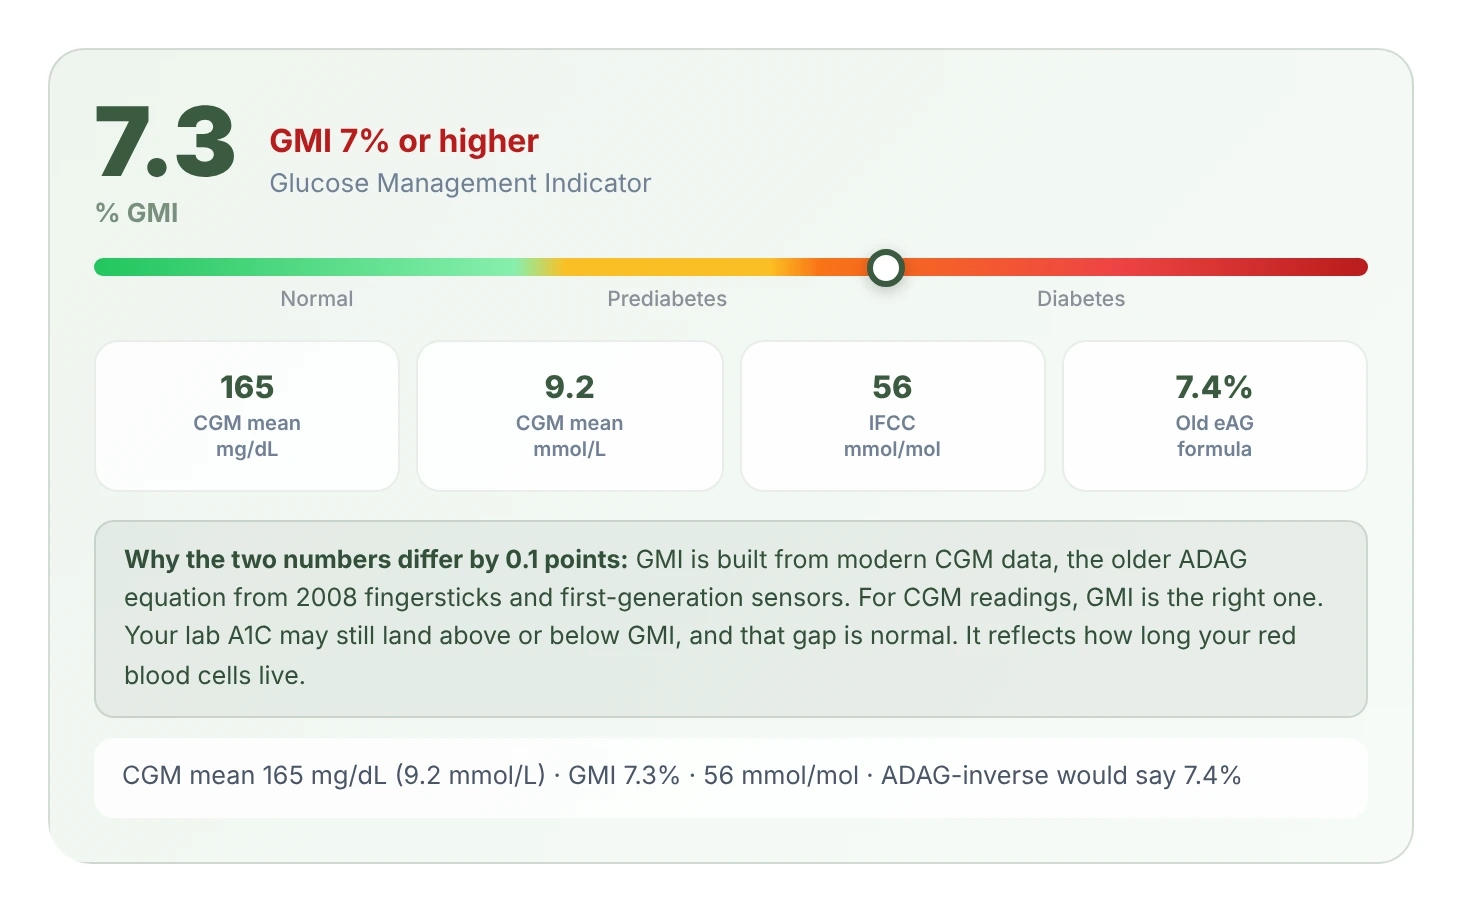
- GMI: 7.3%, labeled “GMI 7% or higher”
- Average: 165 mg/dL, or 9.2 mmol/L
- IFCC unit: 56 mmol/mol
- Older eAG formula: 7.4%
That “older eAG formula” card is the 2008 ADAG equation from 507 people, run backward. The older formula and GMI land only 0.1 points apart here, because the two lines cross near 154 mg/dL. Move far from that average and they split. At 250 mg/dL the calculator shows 9.3% for GMI and 10.3% for the older formula.
Now say this person has a lab A1C drawn right after those two weeks and it reads 6.8%. Their lab runs 0.5 points below their GMI. That gap is the useful part. If their next report shows an average of 150 mg/dL (GMI 6.9%) and nothing big has changed, a lab A1C of about 6.4% is a fairer guess than 6.9%. Treat that as a working guess to check, not a promise.
This idea has early backing. A Vancouver clinic study posted in December 2025 looked at 4,891 CGM and A1C pairs. For people who already had a past gap on record, using it cut the share of big misses (0.5 points or more) from 39.4% to 15.2%. It’s a preprint that hasn’t been peer reviewed yet, so take it as promising, not proven.
The GMI authors also flag a safety point. If your GMI always runs lower than your A1C, say 6.6% against a lab target of 7.0%, pushing harder for a lower A1C could mean more lows. Check your time below range before changing anything.
GMI Without Diabetes: Why Wellness CGMs Read High
This is the problem almost nobody explains. Since the FDA cleared the first over-the-counter CGM in March 2024, for adults who don’t use insulin, more people without diabetes are wearing one. GMI is often used to estimate their A1C, but the formula wasn’t built on them.
A 2023 study gave a CGM to 153 children and adults without diabetes, all with a lab A1C under 5.7%. On average, their GMI ran 0.59 points higher than their lab A1C, and 71% had a gap of 0.4 points or more. One of the authors is Richard Bergenstal, who led the original GMI paper.
A 2026 conference report from the team behind the updated GMI looked at 14,993 people with paired Libre and lab data. A lab A1C of 5.7% lined up with a GMI of 6.0%. Among people with a normal lab A1C, only 19% also had a GMI under 5.7%.
Our own calculator shows the same thing. When I entered an average of 100 mg/dL, it returned a GMI of 5.7% and put it in the “GMI 5.7% to 6.4%” band. An average of 110 mg/dL gave 5.9%. The updated GMI for those same averages is 5.1% and 5.5%.
So a GMI of 5.8% on a wellness CGM doesn’t mean you have prediabetes. Only a lab test can tell you that. The ADA diagnoses diabetes from a lab A1C, fasting glucose or a glucose tolerance test, and usually wants two abnormal results.
Which Is More Accurate, GMI or A1C?
Neither one wins every time, because they don’t measure the same thing. A lab A1C has been the standard for decades, and it’s strongly linked to complications. GMI is faster and shows what’s happening now, but it’s only as good as your sensor and the formula behind it, and CGM numbers haven’t yet been tied to long-term outcomes in strong studies.
Some researchers think GMI should go. Elizabeth Selvin’s 2024 review argued that GMI “performs poorly as an estimate of HbA1c” and that average glucose and time in range are cleaner targets. The GMI team has since published the 2026 update instead of dropping it. Either way, when your two numbers disagree, it pays to find out why rather than just picking the one you like.
Time in range is a useful bridge. The international consensus on CGM targets found that 70% time in range (70 to 180 mg/dL) lined up with an A1C of about 7%, and each extra 10% of time in range matched about a 0.5-point drop in A1C.
What to Do When Your GMI and A1C Don’t Match
- Check your data first. The ADA asks for at least 14 days of wear with the sensor active 70% of the time. Fewer days make GMI shaky.
- Line up the dates. Compare a lab A1C with the GMI from the two weeks right before the blood draw.
- Think about the last month. Illness, steroids, a new diet or a new medicine explain a lot of gaps. Those are about timing, not about your body.
- Track your gap over two or more pairs. One mismatch tells you little. A gap that stays the same size, in the same direction, tells you how your body runs.
- Stick to one sensor brand when you compare. Two brands can give different GMIs for the same days.
- Ask about your A1C test if the gap is big and steady. Anemia and hemoglobin variants can throw it off, and kidney disease is linked to bigger gaps. When A1C can’t be trusted, doctors sometimes use fructosamine, and you can convert a fructosamine result to see where it lands.
- Watch your lows, especially if your GMI runs below your A1C.
GMI also moves faster than A1C when you change something, which is why it’s handy while you wait to see how long A1C takes to drop. To check your own numbers, enter your CGM average in the GMI to A1C calculator and compare it with your last lab result.
This article is for informational purposes only and does not constitute medical advice or diagnosis. Always consult a qualified healthcare professional.
Frequently Asked Questions
For diagnosis and long-term risk, a lab A1C is the standard. GMI is quicker and shows the last two weeks, but it’s an estimate. In GMI vs A1C comparisons, the two differ by 0.3 points or more about half the time. Neither is wrong; a steady gap often reflects your red blood cells or your sensor.
There’s no official GMI goal. The ADA’s 2026 Standards say goals for GMI aren’t standardized. Many adults with diabetes aim for a lab A1C under 7% and time in range above 70%. A GMI near 7% matches an average of about 154 mg/dL, but your own lab gap may shift that.
GMI is already on the A1C scale, but it isn’t a lab result. For a closer guess, the GMI calculator applies the updated 2026 GMI for you. You can also use your own gap: compare a lab A1C with your GMI from before it, then adjust future GMIs by that amount and recheck it.”
A longer window covers more of the time your A1C reflects, so it can line up better. Fourteen days is the minimum the ADA asks for. In a 2025 clinic study (not yet peer reviewed), adding a person’s past gap helped most with 90 days of data, less with 28 days and least with 14.
GMI only depends on your average glucose, so anything that lowers your average lowers GMI. Each 10 mg/dL drop in your average takes GMI down by about 0.24 points (0.02392 × 10). Food, activity, sleep and medicine changes all count. Talk to your care team before changing insulin or other medicine.
No. Diagnosis needs a lab A1C, a fasting glucose or a glucose tolerance test. GMI also tends to read high in people without diabetes. In one study it averaged 0.59 points above their lab A1C, so a GMI of 5.8% on a wellness CGM doesn’t mean prediabetes on its own.
Each sensor reads your glucose a little differently, and GMI comes straight from that average. When 176 adults wore an Abbott and a Dexcom sensor at the same time, their two GMIs typically differed by about 0.3 points, and 26% differed by 0.5 points or more.
Sources
Figures on this page come from peer-reviewed studies, official guidelines and an FDA notice, plus our own calculations from published formulas. Two newer sources are marked: a 2026 conference abstract and a 2025 preprint that has not been peer reviewed. Last verified November 2026.
- Bergenstal RM, Beck RW, Close KL, et al. Glucose Management Indicator (GMI): A New Term for Estimating A1C From Continuous Glucose Monitoring. Diabetes Care. 2018;41(11):2275-2280. doi:10.2337/dc18-1581.
- American Diabetes Association Professional Practice Committee. 6. Glycemic Goals, Hypoglycemia, and Hyperglycemic Crises: Standards of Care in Diabetes-2026. Diabetes Care. 2026;49(Suppl 1). doi:10.2337/dc26-S006.
- Selvin E. The Glucose Management Indicator: Time to Change Course? Diabetes Care. 2024;47(6):906-914. doi:10.2337/dci23-0086.
- Bergenstal RM, Xu Y, Dunn TC, Choudhary P, Ajjan RA. Updated glucose management indicator (GMI) better aligns with HbA1c than current GMI: implications for clinical practice and reporting. Diabetologia. 2026;69(8):2182-2188. doi:10.1007/s00125-026-06739-w.
- Montaser E, Abad SE, Shah VN. Changes in A1C Versus GMI Across Glycemic Categories in Clinical Trials of Type 1 Diabetes. Journal of Clinical Endocrinology & Metabolism. 2025;110(12):e4182-e4187. doi:10.1210/clinem/dgaf211.
- Nathan DM, Kuenen J, Borg R, et al. Translating the A1C assay into estimated average glucose values. Diabetes Care. 2008;31(8):1473-1478.
- Cruz G, Alqahtani A, Khan N, Hawke K, Elliott T. Leveraging past GMI vs A1c discordance markedly improves A1c prediction in a real-world cohort. medRxiv (preprint, not peer reviewed). December 2025.
- U.S. Food and Drug Administration. FDA Clears First Over-the-Counter Continuous Glucose Monitor. FDA News Release; March 5, 2024.
- Shah VN, Vigers T, Pyle L, Calhoun P, Bergenstal RM. Discordance Between Glucose Management Indicator and Glycated Hemoglobin in People Without Diabetes. Diabetes Technology & Therapeutics. 2023;25(5):324-328.
- Ajjan R, Xu Y, Dunn T, Choudhary P, Bergenstal RM. 1297-OR: Overdiagnosis of Prediabetes by GMI: Use of Updated GMI Improves Alignment with HbA1c and Time Above Range. Diabetes. 2026;75(Supplement 1). Conference abstract doi:10.2337/db26-1297-OR.
- American Diabetes Association Professional Practice Committee. 2. Diagnosis and Classification of Diabetes: Standards of Care in Diabetes-2026. Diabetes Care. 2026;49(Suppl 1):S27-S49. doi:10.2337/dc26-S002.
- Battelino T, Danne T, Bergenstal RM, et al. Clinical Targets for Continuous Glucose Monitoring Data Interpretation: Recommendations From the International Consensus on Time in Range. Diabetes Care. 2019;42(8):1593-1603. doi:10.2337/dci19-0028.