Dr. Farah Taqueer is a pediatrician based in Karachi with more than 14 years of clinical experience. She qualified with an MBBS from Liaquat University of Medical and Health Sciences and holds an MD in Pediatrics, and is registered with...
Your fructosamine to A1C result tells you roughly where a few weeks of blood sugar would sit on the A1C (HbA1c) scale your doctor uses. Type your number into the calculator. It uses the Cohen equation, the one in the 2026 MDCalc Journal review, so a fructosamine of 317 µmol/L comes out at 7.0%. You also get average glucose, the formula for kids and an optional albumin correction.
How to Convert Fructosamine to A1C
The calculator runs the Cohen formula, which came from 153 people who had both tests on the same blood sample:
A1C (%) = 0.017 × fructosamine (µmol/L) + 1.61
Let's try it with 300 µmol/L:
Multiply by 0.017: 0.017 × 300 = 5.10
Add 1.61: 5.10 + 1.61 = 6.71. Round it and you get 6.7%.
For average glucose, put 6.7 into 28.7 × 6.7 − 46.7. You get 145.6, or about 146 mg/dL.
That last step is the ADAG formula. It came out of a study of 507 people, and it's how an A1C gets turned into an average glucose number. Got your fructosamine in mmol/L instead? Just tap the mmol/L button. 0.285 mmol/L and 285 µmol/L are the same thing.
You can go backward, too. Choose "A1C → Fructosamine," enter 7.0, and the calculator works out (7.0 − 1.61) ÷ 0.017 = 317 µmol/L. So if your A1C is 7%, a fructosamine around 317 is about what you'd expect to see.
For kids, the result card adds a second number from the Kang equation: A1C = (fructosamine + 45.84) ÷ 48.55. Kang's team built it from 245 paired samples taken from 74 Korean children and teens with diabetes. If you look the paper up, you'll see the constant printed as 5.84 in the text. That's a misprint. Their own Table 2 puts 245 µmol/L at an A1C of 6%, and only 45.84 gives that answer, so 45.84 is what the calculator uses.
We made Cohen the default because it's the equation the 2026 MDCalc Journal review covers, and it matches the worked examples in the Cleveland Clinic Journal of Medicine (317 µmol/L ≈ 7%, 375 µmol/L ≈ 8%).
Fructosamine to A1C Conversion Chart
Find your fructosamine in the first column. The middle columns are what this calculator shows. The last column runs the same value through all five published equations covered in the next sections, so you can see how much the answer can move.
Fructosamine (µmol/L)
A1C, Cohen (%)
eAG (mg/dL)
Range, 5 formulas (%)
200
5.0
97
4.3–6.2
225
5.4
108
5.3–6.6
250
5.9
123
5.9–7.0
275
6.3
134
6.3–7.4
285
6.5
140
6.5–7.5
300
6.7
146
6.7–7.7
317
7.0
154
7.0–8.1
350
7.6
171
7.6–8.9
375
8.0
183
8.0–9.4
400
8.4
194
8.4–10.0
450
9.3
220
9.3–10.9
500
10.1
243
10.1–11.8
How this was made: healthcalculator.io ran each fructosamine value through the Cohen equation with the same rounding as the calculator (A1C to one decimal, then eAG to the nearest mg/dL). The last column uses the Cohen, Kang, Chandran, Zafon and Young equations, rounded to one decimal. It's a calculation from published formulas, not data about real patients.
Example: What a Fructosamine of 285 µmol/L Converts To
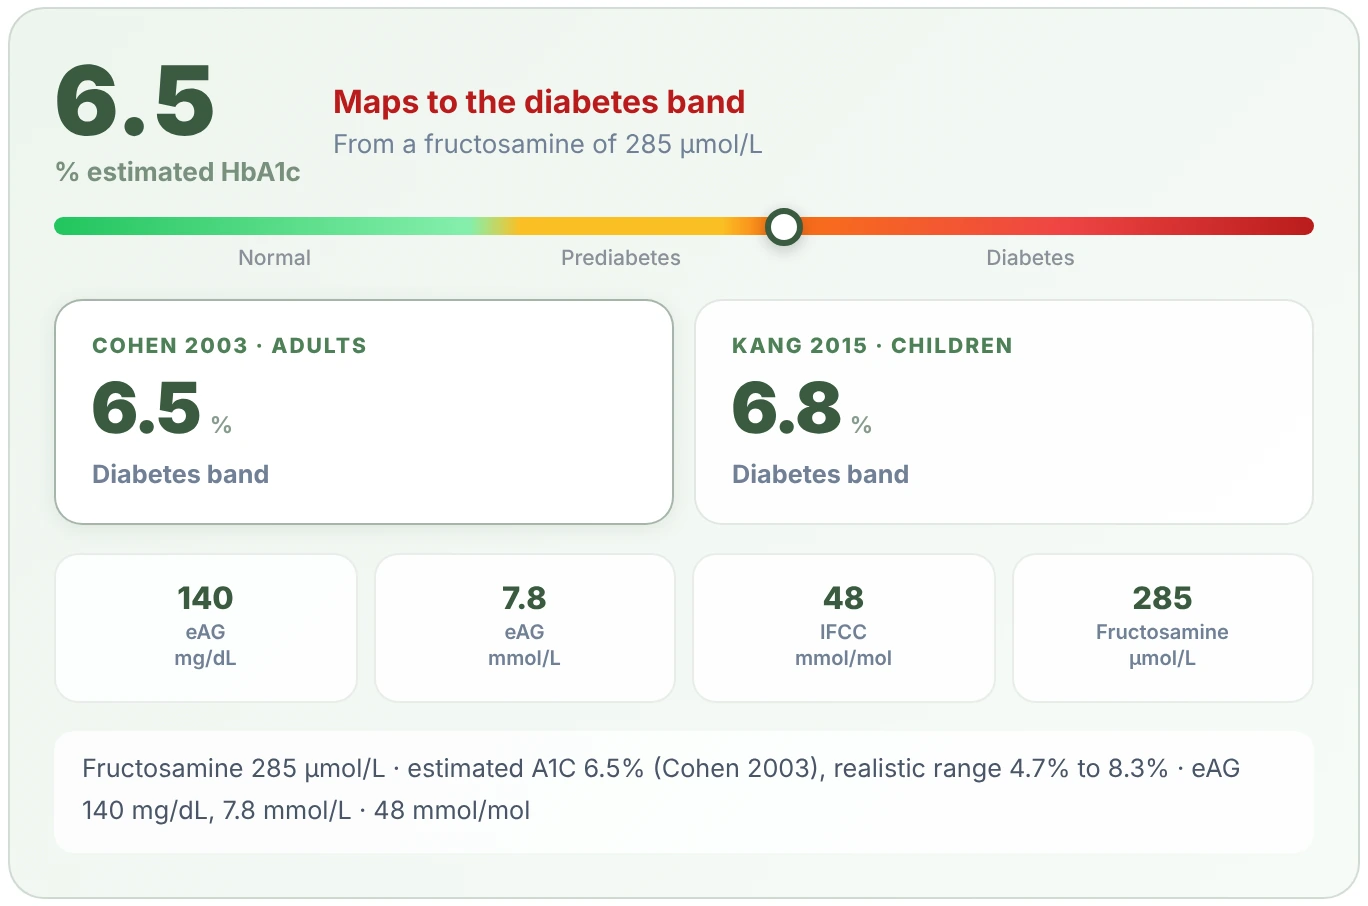
On November 9, 2026, I typed 285 µmol/L into this fructosamine to A1C calculator, left the equation on the adult default and kept the albumin box empty. This is what came back:
Estimated A1C: 6.5%, "Maps to the diabetes band"
Kang (children) equation: 6.8%
Average glucose (eAG): 140 mg/dL, or 7.8 mmol/L
IFCC unit: 48 mmol/mol
Realistic range: 4.7% to 8.3%
What does that mean in real life? 285 µmol/L sits right at the top of what labs call normal. Yet once it's converted, it lands exactly on 6.5%, the A1C cutoff for diabetes. A result like this is a good reason to ask for a proper A1C or fasting glucose test. It isn't a diagnosis by itself. The realistic range tells the fuller story, since someone with this fructosamine could have a normal A1C or a clearly high one.
That same day I ran 285 through three other free converters that rank for this search. The first said 6.4%, since it uses a different formula. Its "Cohen" setting gave 4.7%, which isn't what Cohen's published formula gives. The second showed 6.5% but called it prediabetes, because it checked the raw 6.455 against the 6.5% cutoff before rounding. We round to one decimal first and then pick the band, so the label you see always fits the number you see.
Why Fructosamine Formulas Give Different A1C Results
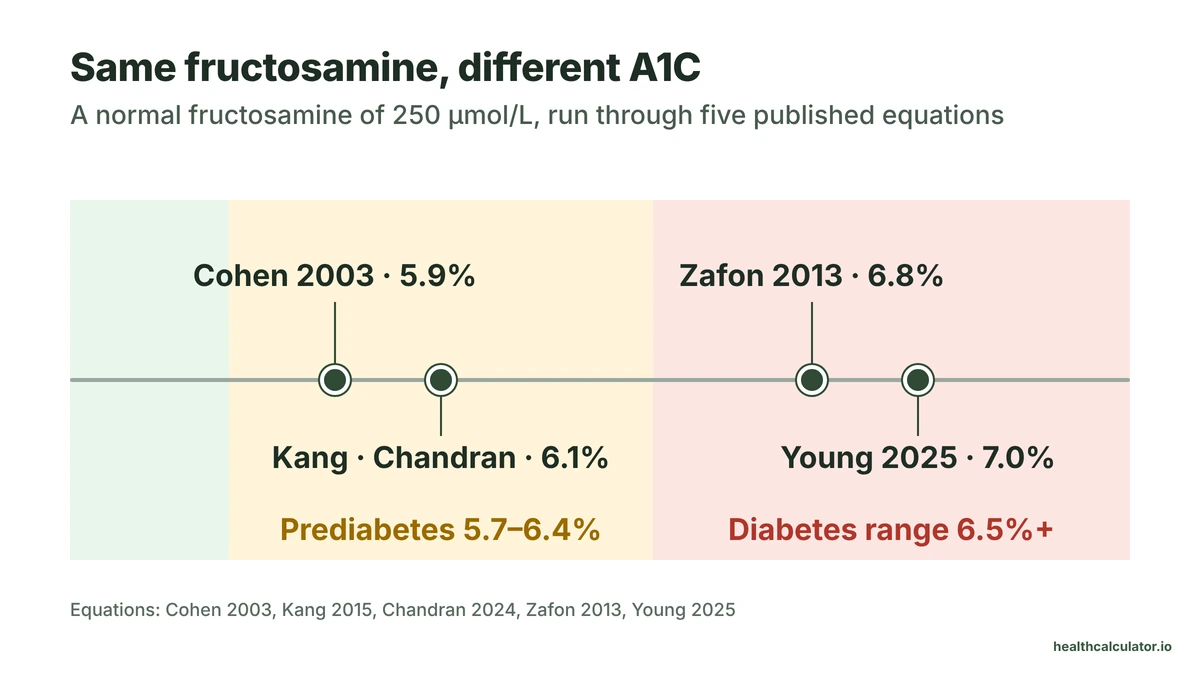
Most converters show one number and stop. But at least five published equations turn fructosamine into A1C, and they don't agree. Run the same normal result through all of them and the answer spreads across three bands:
At 250 µmol/L, Cohen says 5.9%, Kang and Chandran say 6.1%, Zafon says 6.8% and Young says 7.0%. That's a gap of about one full point from a single lab result. At 285 µmol/L the answers run from 6.5% to 7.5%.
Why so different? Two reasons stand out:
Fructosamine tests aren't standardized. The MDCalc Journal review points to this lack of assay standardization as the reason no one has set official fructosamine cutoffs. Two labs can report different numbers for the same blood.
Each equation came from a different group. Cohen studied 153 people with an average A1C of 7.9%. Zafon studied 508 people with type 2 diabetes. Chandran studied 193 adults in Singapore, some without diabetes. Young studied 156 US veterans. Kang studied 74 children.
From 250 µmol/L upward, Cohen gives the lowest answer in every row of the chart. So if the calculator puts you at 6.3%, the other equations would place you higher, not lower. Keep that in mind when a result lands just under a cutoff.
The fix is simple: compare your fructosamine with your own earlier results from the same lab. A trend in one lab's numbers is more useful than any single conversion.
Normal Fructosamine Range
Labcorp lists a normal fructosamine of 205 to 285 µmol/L for healthy adults aged 20 to 60. Mayo Clinic Laboratories prints 200 to 285 µmol/L. Labcorp also lists 228 to 563 µmol/L, with an average of 396, in people whose diabetes is poorly controlled.
Notice how much those two groups overlap. A result of 250 µmol/L fits inside both. That's why the calculator has a "My lab's fructosamine range" box: your own report's range beats any textbook one, and the calculator flags you against it.
Through the Cohen equation, the normal range of 205 to 285 µmol/L covers an A1C of about 5.1% to 6.5%. The top of "normal" for fructosamine sits right on the A1C line for diabetes.
A high fructosamine usually means higher average blood sugar over the last few weeks. A low one can come from low protein levels in the blood, such as low albumin, rather than from low sugar.
Fructosamine vs A1C: When Each Test Can Be Trusted
A1C is still the main test. The ADA's 2026 Standards of Care say fructosamine or CGM can be used when an alternative to A1C is needed. The same section notes that fructosamine reflects the past 2 to 4 weeks, and that its evidence base is much weaker than A1C's.
Each test has its own blind spots:
A1C can mislead with
Fructosamine can mislead with
Some hemoglobin variants
Liver disease
Red blood cell lifespan problems
Nephrotic syndrome (a kidney problem that leaks protein)
Burns or protein-losing gut conditions
Overactive thyroid
Multiple myeloma or other abnormal blood proteins
Malnutrition or low albumin
The fructosamine column comes from the conditions the MDCalc Journal review lists as reasons not to use this calculator. The Cleveland Clinic Journal of Medicine covers when an A1C can't be trusted.
Fructosamine's short window is also its strength. After a change in treatment, it moves within weeks, while A1C reflects the past 2 to 3 months, per the same ADA section. That lag also explains how long lowering A1C takes after a change. If your A1C is the number you trust, the A1C calculator converts it to average glucose and back.
How to Use Your Glycation Gap
Sometimes you have both tests from the same blood draw, and they don't agree. The difference has a name: the glycation gap. It's your measured A1C minus the A1C your fructosamine predicts.
In Cohen's study the gap ranged from −3.2 to +5.5 points, and 40% of samples differed enough to change the predicted risk of complications. The gap also held steady. In 65 people tested twice about 23 weeks apart, the two gaps lined up closely (r = 0.81). A later study of 508 people found it was linked to kidney function (creatinine), a red blood cell measure called MCHC and metformin use.
That steadiness makes the gap useful as a personal correction. Choose "Glycation gap" in the calculator and enter both results.
Worked example (example numbers, not a real patient):
The calculator predicts 6.5% from the fructosamine, so the gap is +0.7 points. That's "positive."
Months later, only a fructosamine is available: 330 µmol/L, which predicts 7.2%.
Add your +0.7: about 7.9% is a better guess for that person than 7.2%.
The calculator calls a gap above +0.5 positive, below −0.5 negative and anything between neutral. Those are the same bands the 508-person Zafon study used.
Treat this as a talking point for your doctor, not a proven method. A study of 3,182 people called the gap "an essentially unproven concept," yet found that a positive gap came with higher odds of kidney damage (1.55 times) and of eye damage from diabetes (1.24 times). The risk of dying during the study was about twice as high at both ends, for a clearly negative gap and for a clearly positive one.
The realistic range of plus or minus 1.8 points on the result card is our own choice, not a published cutoff. It's twice the 0.9 standard deviation of the gap in that 508-person study, so most people's true A1C should fall inside it.
Low Albumin Can Make Fructosamine Read Too Low
Most of what fructosamine picks up is sugar stuck to albumin, the main protein in your blood. So if your albumin is low, there's simply less protein for sugar to stick to. Your fructosamine can come back low even when your blood sugar isn't. The calculator counts 3.5 to 5.0 g/dL as a normal albumin.
Back in 1991, researchers who studied 131 adults with type 2 diabetes came up with an easy correction: fructosamine × 4 ÷ albumin, using albumin in g/dL. The biggest gain showed up in the 24 people whose albumin was above 4.5 or below 3.5. For them, the corrected number tracked fasting glucose much more closely, with r going from 0.389 up to 0.788.
Here's how that looks in the calculator, with example numbers:
Input
Without albumin
With albumin 3.0 g/dL
Fructosamine used
240 µmol/L
240 × 4 ÷ 3.0 = 320 µmol/L
Estimated A1C
5.7%
7.1%
That's the difference between "borderline" and "above the 7% goal." The calculator shows the corrected A1C in a note and keeps the main number uncorrected. A 2021 review in the Cleveland Clinic Journal of Medicine says albumin correction has not been widely adopted, so treat it as a second opinion. If you're not sure what your albumin result means, this guide on what low albumin means walks through it.
What to Do With Your Estimated A1C
Your converted number is an estimate from a test with no official cutoffs. Here's how to use it well:
Don't use it to diagnose diabetes. The ADA diagnoses with A1C, fasting glucose or a glucose tolerance test, and usually wants two abnormal results.
Compare like with like. Track fructosamine from the same lab over time.
Mention anything from the table above that could throw off either test, like low albumin, kidney or liver disease, or a hemoglobin variant.
Ask about CGM if neither A1C nor fructosamine feels trustworthy. ADA lists CGM as the other option. If you already wear one, see how a CGM's GMI compares with A1C.
See your doctor soon if your numbers keep rising, or if you have signs of high blood sugar like peeing a lot, heavy thirst or weight loss you can't explain.
This calculator is for informational and screening purposes only and does not constitute medical advice or diagnosis. Always consult a qualified healthcare professional.
Frequently Asked Questions
The most used fructosamine to A1C formula is Cohen's: A1C (%) = 0.017 × fructosamine (µmol/L) + 1.61. Multiply your fructosamine by 0.017, then add 1.61. A result of 300 µmol/L gives 6.71, or about 6.7%. For children, the Kang formula is (fructosamine + 45.84) ÷ 48.55.
Not in general. A1C has far more research behind it, and the ADA calls the evidence for fructosamine much weaker. Fructosamine is more useful when A1C is unreliable, such as with some hemoglobin variants or conditions that change red blood cell lifespan, or when you want to see a change from the last 2 to 4 weeks.
For adults without diabetes, Labcorp lists 205 to 285 µmol/L as normal, and Mayo Clinic Laboratories lists 200 to 285 µmol/L. Your own lab's printed range matters most because tests differ. If you have diabetes, about 317 µmol/L lines up with the common 7% A1C goal, but your doctor sets your personal target.
No. They measure different things over different time spans: sugar on blood proteins over 2 to 4 weeks versus sugar on hemoglobin over about 3 months. In Cohen's study the two correlated at r = 0.78, which means fructosamine explained about 61% of the variation in A1C (0.78 × 0.78). The rest is why conversions can miss.
The usual reason is higher average blood sugar over the past few weeks, from diabetes that isn't well controlled or a recent rise in glucose. Unusual blood proteins, as in multiple myeloma, can also throw the result off. One high result isn't a diagnosis, so your doctor will usually check an A1C or a fasting glucose next.
Both come out at about 6.7% with the Cohen equation: 0.017 × 299 + 1.61 = 6.69, and 0.017 × 300 + 1.61 = 6.71. That's an estimated average glucose of about 146 mg/dL. Other published equations put 300 µmol/L as high as 7.7%, so treat 6.7% as the low end.
No. Fructosamine has no accepted cutoffs for diagnosing diabetes because the tests aren't standardized between labs. It's used to monitor blood sugar, mostly when an A1C can't be trusted. The ADA diagnoses diabetes with an A1C, a fasting glucose or a glucose tolerance test, and usually needs two abnormal results to confirm.
Have clinical or research experience with this calculator? If you spot an error in the formula, the thresholds or the sources, or you would like to contribute to this page, write to partnerships@healthcalculator.io.
Sources
Every figure on this page is drawn from government health statistics or peer-reviewed research. Last verified November 2026.