
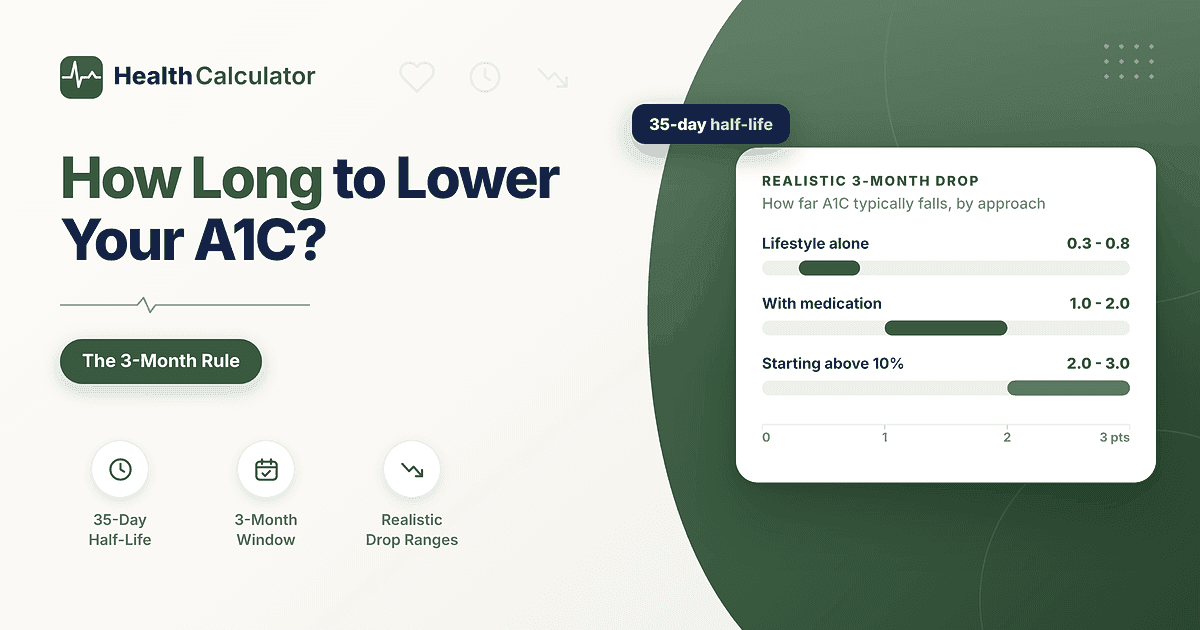
About 85% of any A1C change shows up within three months. Cut your average glucose enough to move your A1C by 2 points and roughly 1.7 of those points land by month three. Realistic three-month drops run 0.4 to 0.6 points from exercise alone, and 1.5 to 2.3 points on a GLP-1 medication.
Put your own numbers in and see the schedule:
Enter today’s A1C and the average you are holding now. The method is explained below.
~45% there
~70% there
~84% there
if held
Why A1C moves slowly, and exactly how slowly
Your A1C is not a measurement of your blood sugar today. It is the percentage of your hemoglobin that has glucose stuck to it, and hemoglobin lives inside red blood cells that survive around 120 days. Sugar attaches gradually. It comes off only when the cell dies and gets replaced.
So when your glucose drops, your A1C does not drop with it. It waits for your red blood cells to turn over.
In 1995 two researchers put a number on that wait. Tahara and Shima admitted nine people with newly diagnosed type 2 diabetes, normalized their blood sugar quickly, then tracked three different glycation markers on the way down. Their fasting glucose fell with a half-time of 6.3 days. Their A1C took far longer: a half-time of 34.6 days, plus or minus 10.
Call it 35 days. That single figure is the whole answer to this question.
A half-life of 35 days means the gap between where your A1C is now and where it is heading closes by half roughly every five weeks. Not all at once at the three-month mark, and not evenly across the quarter either. Front-loaded, then trailing off.
The same study found something else worth knowing. A1C does not reflect a simple average of your recent months. It reflects a weighted average, and the weighting is heaviest on the days closest to the test, tapering as you go back. Tahara and Shima put the maximum weight on the days immediately before the blood draw, with the curve extending back roughly 100 days and thinning out the whole way.
Which means last month counts more than three months ago. Good news if you started recently. Bad news if you had a rough fortnight right before your appointment.
The schedule: what actually lands at 1, 2 and 3 months
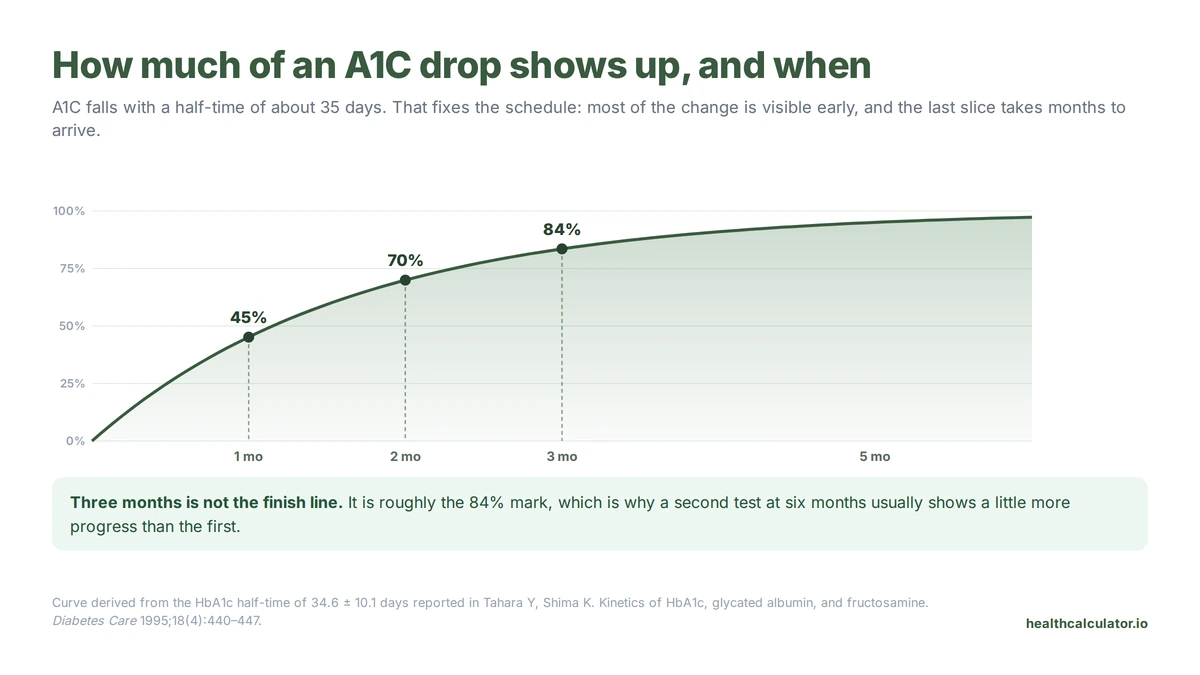
Run a 35-day half-life forward and the timeline stops being vague. Here is the share of your total A1C change that should be visible at each point.
| Time since your glucose changed | Share of the change visible | On a 2.0-point total drop | On a 1.0-point total drop |
|---|---|---|---|
| 2 weeks | About 24% | 0.5 points | 0.2 points |
| 1 month | About 45% | 0.9 points | 0.5 points |
| 2 months | About 70% | 1.4 points | 0.7 points |
| 3 months | About 84% | 1.7 points | 0.8 points |
| 4 months | About 91% | 1.8 points | 0.9 points |
| 6 months | About 97% | 1.9 points | 1.0 points |
Read the first row again. Two weeks of perfect eating buys you about a quarter of the eventual change. That is why people who overhaul their diet, retest after a fortnight and see almost nothing conclude the diet failed. It did not fail. The test just has not caught up.
And read the last two rows. Three months is not the finish line, it is roughly the 84% mark. This is why doctors retest at three months and then again at six: the second test catches the tail.
How much can A1C realistically drop in 3 months?
Now the part where the internet gets loud. Search this question and you will find Reddit threads about 12.1 down to 4.9, and blog posts promising two points in twelve weeks. Some of those stories are real. Most involve either a very high starting number, a new medication, or both.
Here is what the trial evidence actually supports.
| What you change | Typical A1C reduction | Over what period |
|---|---|---|
| Physical activity advice alone | 0.35 points | 12 weeks or more |
| Resistance training | 0.40 points | 12 weeks or more |
| Aerobic training | 0.58 points | 12 weeks or more |
| Combined aerobic and resistance | 0.58 points | 12 weeks or more |
| High-intensity interval training | 0.61 points | 12 weeks or more |
| Semaglutide 1 mg | 1.86 points | 40 weeks |
| Tirzepatide 5 to 15 mg | 2.01 to 2.30 points | 40 weeks |
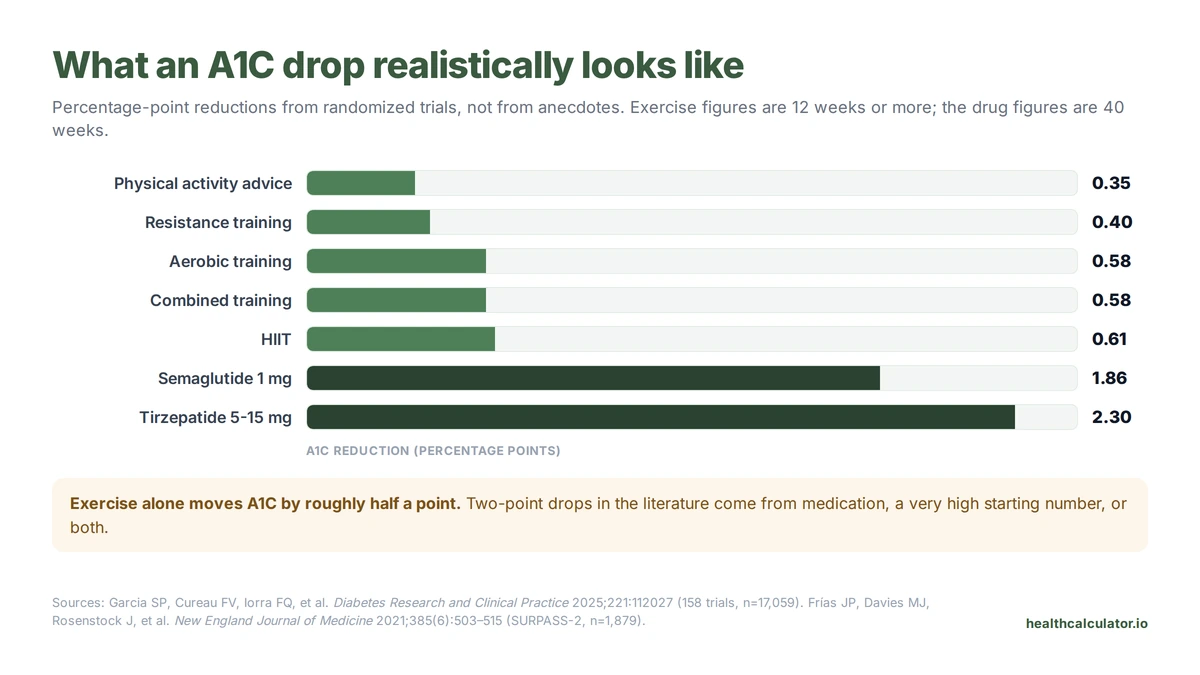
The exercise figures come from a 2025 network meta-analysis of 158 randomized trials covering 17,059 people with type 2 diabetes. HIIT came out on top at 0.61 percentage points, with aerobic and combined training close behind. Even being told to move more, with no supervised program at all, was worth 0.35 points.
The medication figures come from SURPASS-2, a 40-week head-to-head trial in 1,879 people starting at a mean A1C of 8.28%. Semaglutide brought it down 1.86 points; tirzepatide managed 2.01 to 2.30 depending on dose.
Two things jump out. First, exercise alone moves A1C by roughly half a point, not two points. Second, the drug trials ran 40 weeks, not 12. Even the strongest interventions in the literature take longer than a quarter to deliver their full effect, which is exactly what a 35-day half-life predicts.
The honest range for three months, then. Lifestyle changes alone: 0.3 to 0.8 points for most people. Lifestyle plus a new medication: 1 to 2 points. Starting from a very high A1C, above 10%, with insulin or a GLP-1 added: 2 to 3 points is genuinely possible, because the gap you are closing is enormous.
Starting low? You will move less. Someone at 6.0% has maybe 0.4 points of room before they hit a normal number. There is no version of this where they drop two.
Worked example: going from 10% down to 7%
This is one of the most searched versions of the question, so let us do it properly.
Say your A1C is 10.0%. Your doctor starts you on medication and you tighten up your eating, and your average glucose settles at about 154 mg/dL, which corresponds to an A1C of roughly 7.0% using the ADAG equation the American Diabetes Association adopted.
Your total gap is 3.0 points. Apply the schedule:
- Month 1: 10.0 minus (3.0 × 0.45) = 8.6%
- Month 2: 10.0 minus (3.0 × 0.70) = 7.9%
- Month 3: 10.0 minus (3.0 × 0.84) = 7.5%
- Month 6: 10.0 minus (3.0 × 0.97) = 7.1%
So you hit 7% at around six months, not three. At the three-month retest you are at 7.5%, which looks like falling short of the target when it is actually dead on schedule.
That gap between "on track" and "feels like failure" is where a lot of people quit. Do not.
Can you lower your A1C overnight, or before a blood test?
No. And it is worth understanding why, because the answer is not willpower, it is arithmetic.
With a half-life of 35 days, a single day of perfect eating changes your A1C by roughly 2% of the eventual effect. On a 2-point potential drop, that is 0.04 points. Your lab reports to one decimal place. It would not even register.
Three days of fasting before a draw does nothing measurable either. Neither does drinking a lot of water, which moves the concentration of nothing that matters here. A1C is a percentage of your hemoglobin, not a concentration in your plasma, so diluting your blood does not dilute your A1C.
What about before surgery? Some procedures require an A1C below a threshold. If you are in that position, the useful move is not a crash diet in the final week, it is a conversation with your surgical team about the actual timeline, because meaningful change needs six to eight weeks minimum. A tight two-week push before the draw buys you around a quarter of whatever it would eventually be worth.
There is one exception, and it is not the one people hope for. Things that make your A1C read lower without your glucose improving at all. Recent blood loss, a transfusion, hemolytic anemia, sickle cell or HbC trait, and erythropoietin therapy can all lower the result artificially. That is a distorted test, not progress, and your doctor needs to know about it.
What actually moves faster than A1C
If you need feedback sooner than five weeks, A1C is simply the wrong instrument. Use one with a shorter memory.
The same Tahara and Shima experiment measured two alternatives on the way down. Glycated albumin fell with a half-time of 17.1 days. Fructosamine was faster still at 12.2 days. Their weight functions reached back about 40 and 30 daysrespectively, against A1C's 100.
So if your doctor wants to know whether a change is working after a month, glycated albumin answers roughly twice as fast.
Faster again: a continuous glucose monitor. Time in range and mean glucose respond within days, and 14 days of CGM data gives you a stable picture of where your average is heading long before any lab test confirms it. Our A1C calculatorconverts a CGM average into GMI, which is the metric device makers report instead of an estimated A1C.
That combination, a CGM for the weekly signal and A1C for the quarterly confirmation, is how you avoid three months of flying blind.
Common mistakes when tracking your progress
Retesting too early. An A1C at four weeks captures under half your progress. Most people should wait the full three months, per the standard retest interval.
Reading a small rise as failure. A1C has day-to-day and lab-to-lab variation. A move of 0.1 or 0.2 in the wrong direction is noise, not a verdict.
Comparing your drop to someone else's. A person starting at 11% has four times the room to fall that a person starting at 6.5% does. The same effort produces very different headline numbers.
Assuming the number lies when it disagrees with your meter. Sometimes it does, for real physiological reasons. More often, finger-stick averages read low because most people test before meals and miss the peaks.
Chasing the number instead of the average behind it. A1C is a summary of your glucose. Lower the glucose and the summary follows, always. It just follows slowly.
What to do while you wait
Three months is a long time to work without feedback, so build in some.
Track your glucose average rather than your A1C. That is the input, and it responds immediately. If your two-week average is already where it needs to be, your A1C is on its way whether the lab has noticed yet or not.
Weight is the other lever with strong evidence behind it, and it is visible weekly rather than quarterly. Our BMI calculatorgives you a starting point to track against.
Keep an eye on blood pressure too. High blood pressure and high blood sugar are the two leading causes of kidney damage, which is why the eGFR guide and the MAP calculator belong in the same routine as this one.
And when the retest finally comes back, run it through the full A1C calculator to see what average glucose it corresponds to, and how wide the real uncertainty around that estimate is. The number is more of a range than most people are told.
Three months feels slow. It is also just how long red blood cells take to be replaced, and there is no way to hurry that. The work you did this month is already in your blood. The test simply has not read it yet.
Medical disclaimer
This article is for informational purposes only and does not constitute medical advice or diagnosis. A1C targets are individual, and changes to your diet, exercise or medication should be made with a qualified healthcare professional who knows your history.
Frequently asked questions
Three months captures about 84% of any A1C change, so your ceiling depends on how far your average glucose actually fell. Realistically that is 0.3 to 0.8 points from lifestyle changes alone, 1 to 2 points when a new medication is added, and up to 3 points from a starting A1C above 10%.
About 45% of the eventual change, because A1C falls with a half-time of roughly 35 days. If you are heading for a 1-point drop, expect around 0.5 points at the one-month mark. A four-week retest will always understate your progress.
Barely. Two weeks delivers roughly a quarter of the eventual change, so a 1-point drop shows up as about 0.2 points, close enough to normal test variation to be invisible. Your glucose average will already have improved though, and a meter or CGM shows that long before the lab does.
The same 35-day half-life applies whatever the method, so most of the change lands by three months. The size is what differs. A 2025 meta-analysis of 158 trials found aerobic or combined training lowered A1C by about 0.58 percentage points, and HIIT by 0.61.
Not meaningfully. One day of perfect eating shifts A1C by roughly 2% of its eventual effect, which on a 2-point potential drop is 0.04 points. Fasting, drinking extra water and last-minute crash diets do not change a marker built from three months of red blood cell history.
In the SURPASS-2 trial, semaglutide lowered A1C by 1.86 points and tirzepatide by 2.01 to 2.30 points, but over 40 weeks from a baseline of 8.28%. At three months expect roughly 84% of your own eventual drop, so most of the effect and not quite all.
Three explanations are common. Your average glucose may not have fallen as far as it felt, especially if you mostly test before meals. The drop may be real but small next to normal test variation. Or something is distorting the test itself, such as iron deficiency or a hemoglobin variant.
Every three months while treatment is actively changing, and about twice a year once you are stable and at target. Three months is not arbitrary: it is the point where roughly 84% of any change has arrived, so the result means something without making you wait for the full tail.
Sources
Every figure on this page is drawn from government health statistics or peer-reviewed research. Last verified September 2026.
- Tahara Y, Shima K. Kinetics of HbA1c, glycated albumin, and fructosamine and analysis of their weight functions against preceding plasma glucose level. Diabetes Care. 1995;18(4):440–447. doi:10.2337/diacare.18.4.440.
- Garcia SP, Cureau FV, Iorra FQ, et al. Effects of exercise training and physical activity advice on HbA1c in people with type 2 diabetes: A network meta-analysis of randomized controlled trials. Diabetes Research and Clinical Practice. 2025;221:112027. doi:10.1016/j.diabres.2025.112027.
- Frías JP, Davies MJ, Rosenstock J, et al. Tirzepatide versus Semaglutide Once Weekly in Patients with Type 2 Diabetes. New England Journal of Medicine. 2021;385(6):503–515. doi:10.1056/NEJMoa2107519.
- Nathan DM, Kuenen J, Borg R, et al. Translating the A1C Assay Into Estimated Average Glucose Values. Diabetes Care. 2008;31(8):1473–1478. doi:10.2337/dc08-0545.
- National Glycohemoglobin Standardization Program. Factors That Interfere with HbA1c Test Results. NGSP.