Dr. Farah Taqueer is a pediatrician based in Karachi with more than 14 years of clinical experience. She qualified with an MBBS from Liaquat University of Medical and Health Sciences and holds an MD in Pediatrics, and is registered with...
Your CGM app's GMI isn't your lab A1C, and this calculator shows the A1C you're more likely to see. Enter your GMI or CGM average in the calculator. It uses the updated GMI that GMI's creators published in 2026, so a GMI of 6.0% points to a lab A1C nearer 5.6%. Most GMI to A1C tools just hand your number back. The third tab also uses your own past gap.
How to Convert GMI to A1C
GMI comes from one simple line, the 2018 GMI formula, built from 528 people with diabetes who wore a Dexcom G4 sensor:
GMI (%) = 3.31 + 0.02392 × average glucose (mg/dL)
That's the number your CGM app shows. The catch is that a straight line doesn't fit real lab A1C well at the low and high ends. So in August 2026 the same team published an updated GMI in Diabetologia, tested on 18,860 people. It adds red blood cell factors and cut the typical miss below an A1C of 5.5% or above 9.0% from more than 0.4 points to 0.1 points or less.
Here's what the calculator does with a GMI of 6.0%:
Works back to your average glucose: (6.0 − 3.31) ÷ 0.02392 = 112 mg/dL.
Runs that average through the updated equation, which gives about 37.5 mmol/mol.
Turns mmol/mol into %, with the standard NGSP conversion: 0.09148 × 37.5 + 2.152 = 5.6%.
The updated equation itself is 1 ÷ (0.07808 ÷ average in mmol/L + 0.003889) − 23.497, in mmol/mol. Nobody needs to do that by hand, which is why the calculator exists.
If you work in mmol/L, the formula 12.71 + 4.70587 × average glucose is real, but it gives GMI in mmol/mol, not %. Some summaries online label it as a % formula. Put in an average of 8.5 mmol/L and you get 52.7, which is mmol/mol, roughly 7.0%, not a GMI of 52.7%.
We show the updated GMI as the main number because it's the one built to match a lab A1C. The 2018 GMI still sits on the first card, so you can match it against your app.
Which Tab Should You Use?
The calculator has three tabs, and each one fits a different report:
Tab
When you have
What to enter
GMI → A1C
The GMI from your app's report
Your GMI in % or mmol/mol
CGM avg → A1C
An average glucose on your report
The average in mg/dL or mmol/L
My own gap
A lab A1C plus the GMI from before it
Today's GMI, that lab A1C, and the GMI from the 2 months before the test
If your report shows both GMI and average glucose, use the average. It skips one round of rounding, so the answer can be a touch more exact.
The gap tab works best when the lab result is recent and nothing big has changed since, like a new medicine or a long illness. The model behind it was built on people with type 1 diabetes, so if you have type 2 diabetes or no diabetes, read its answer as a rough guide.
GMI to A1C Chart
Find the GMI your app shows, then read across:
Your GMI (%)
Average glucose (mg/dL)
Expected lab A1C (%)
Usual lab range (%)
5.7
100
5.1
4.6–5.6
5.8
104
5.3
4.8–5.8
6.0
112
5.6
5.1–6.1
6.2
121
5.9
5.4–6.4
6.3
125
6.0
5.5–6.5
6.5
133
6.3
5.8–6.8
6.7
142
6.6
6.1–7.1
7.0
154
7.0
6.5–7.5
7.2
163
7.3
6.8–7.8
7.4
171
7.6
7.1–8.1
7.9
192
8.2
7.7–8.7
8.0
196
8.3
7.8–8.8
9.0
238
9.3
8.8–9.8
10.0
280
10.3
9.8–10.8
How this was made: healthcalculator.io ran each GMI through the calculator's own steps (back to average glucose, then the 2026 updated GMI), rounded to one decimal. These are calculations from published formulas, not results from real people.
Read it like this. Below a GMI of about 6.9%, your lab A1C is likely a little lower than your GMI. Near 7.0% they match. Above that, your lab A1C is likely a little higher. A GMI of 7.9% points to about 8.2%.
The usual lab range is our own band, not a published one: the expected A1C plus or minus 0.5 points. That width comes from the original GMI study, where 72% of people (100% minus the 28% who were off by 0.5 points or more) had a lab A1C within half a point of their GMI.
One popular GMI to A1C calculator lists a formula that runs your GMI back through the 2008 eAG equation, the very equation GMI replaced for CGM data. By that formula a GMI of 9.3% becomes 10.4%, while the updated GMI says about 9.6%.
Example: Estimating A1C From Your Own Gap
The updated GMI is a population average. Your own body can still run high or low. That's what the "My own gap" tab is for.
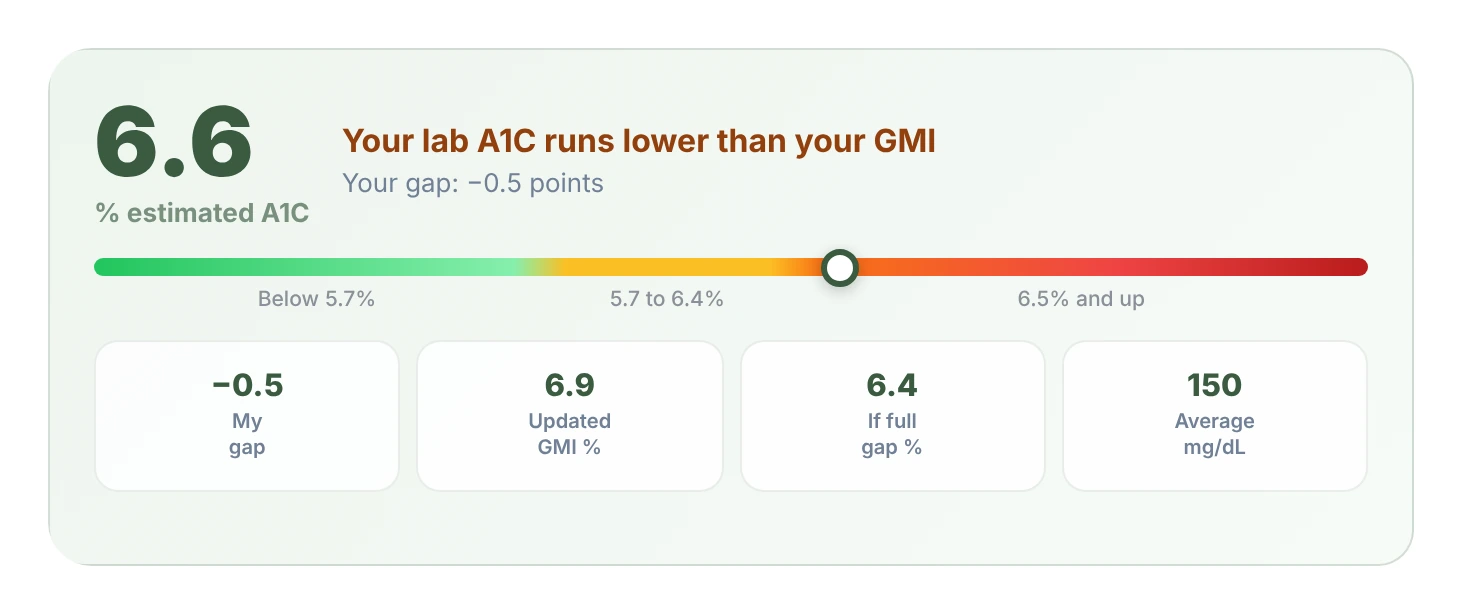
On November 10, 2026, I ran these example numbers through it. They're made up for this page, not someone's report:
Current GMI: 6.9%
Last lab A1C: 6.8%
GMI from before that test: 7.3%
The calculator returned an estimated A1C of 6.6%, labeled "Your lab A1C runs lower than your GMI," with a gap of −0.5 points. The cards show an updated GMI of 6.9%, 6.4% if you subtracted the whole gap, and an average of 150 mg/dL.
Why 6.6% and not 6.4%? Gaps don't stay fixed. The tab uses a model from a 2026 study of 477 people with type 1 diabetes and 1,523 paired results. The direction of the gap held in 51% of repeat pairs, so the model only carries part of your old gap forward. In that study, GMI alone explained 69% of the variation in lab A1C. Adding the past gap raised that to 82%, and the average miss fell from 0.42 to 0.33 points.
So what would I do with 6.6%? Treat it as the best guess until the next lab draw, then enter the new pair and run it again.
The other direction matters more for safety. With a current GMI of 7.0%, a lab A1C of 7.5% and a past GMI of 6.8%, the calculator gives 7.4% and warns: "Check your lows before aiming for a lower A1C." The 2018 GMI paper makes the same point. If your GMI always runs below your A1C, chasing a lower A1C can mean more time low.
I also entered a GMI of 5.8% in the first tab. It returned an expected lab A1C of 5.3% (usual range 4.8% to 5.8%), with the note "This does not mean prediabetes."
What Is the Glucose Management Indicator?
The glucose management indicator, or GMI, is a number worked out from your CGM's average glucose and put on the A1C scale. Before 2018 it was called "estimated A1C." The FDA's device division raised concerns that the old name made it sound like a lab result, so the team behind it renamed it GMI. It now appears on the standard summary reports that CGM makers produce.
Not everyone likes it. A 2024 review by Elizabeth Selvin in Diabetes Care argued that GMI performs poorly as an estimate of a lab A1C and that average glucose and time in range work better as targets. The 2026 updated GMI is the original team's answer to that problem, and it's the version this calculator puts first.
What Is a Good GMI?
There's no official GMI goal. The ADA's 2026 Standards list GMI as a value approximating A1C that's "not always equivalent," and say goals for it aren't standardized. What the ADA does set is a lab A1C under 7% for many adults and time in range above 70% for people using a CGM.
So the useful question is what lab A1C your GMI points to:
Your GMI
Expected lab A1C
What it means
6.2%
5.9%
In the prediabetes range on a lab test (5.7% to 6.4%)
6.5%
6.3%
Still under the 6.5% diabetes line on a lab test
7.0%
7.0%
Right at the 7% goal for many adults with diabetes
8.0%
8.3%
Above the 7% goal
The 5.7% and 6.5% lines are ADA lab cutoffs. Some calculators grade GMI as "optimal," "great," "good" or "poor," but no guideline publishes those bands.
Does a GMI of 5.7% or Higher Mean Prediabetes?
No, and this trips up a lot of people who wear a CGM without diabetes. The 2018 formula came from people with diabetes, and it reads high at the low end. A 2023 study of 153 people without diabetes found their GMI ran 0.59 points higher than their lab A1C on average. A 2026 conference report from the team behind the updated GMI found that a lab A1C of 5.7% lined up with a GMI of about 6.0%.
That's why the calculator adds "This does not mean prediabetes" whenever your app's GMI is 5.7% or more but the updated estimate is below 5.7%. Only a lab A1C, a fasting glucose or a glucose tolerance test can diagnose it, and the ADA usually wants two abnormal results. The guide on GMI vs A1C covers wellness CGMs in more detail.
When This GMI Calculator Is Less Accurate
Less than 14 days of data. The ADA asks for at least 14 days of wear with the sensor active 70% of the time.
Very low or very high averages. The updated GMI was tested on averages from about 74 to 350 mg/dL (4.1 to 19.4 mmol/L). Outside that, the calculator shows a warning instead of a range.
A recent change. Illness or steroids push GMI up before your A1C follows. A new diet or medicine does the opposite.
Red blood cell problems. Hemolytic anemia and hemoglobin variants can push a lab A1C away from any GMI.
Switching sensors. When people wore two brands at once, their GMIs often differed by 0.3 points, and 26% differed by 0.5 points or more.
The gap tab and type 2 diabetes. The gap model came only from people with type 1 diabetes, and it used about 60 days of CGM data before each lab test.
What to Do With Your Result
Use the expected A1C to set your expectations before a lab draw, not to replace it. Take your CGM report and the result from this GMI calculator to your next appointment, so your doctor can see both numbers side by side. If you only have a lab A1C and want average glucose, the A1C to average glucose calculator does that in both directions. If you've just changed something, see how long A1C takes to fall, because GMI will move weeks before your lab result does. And if your A1C itself can't be trusted, ask your doctor about fructosamine, which you can turn into an estimated A1C.
This calculator is for informational and screening purposes only and does not constitute medical advice or diagnosis. Always consult a qualified healthcare professional.
Frequently Asked Questions
GMI (%) = 3.31 + 0.02392 × your average CGM glucose in mg/dL, using at least 14 days of data. An average of 154 mg/dL gives a GMI of 7.0%. For GMI to A1C, the updated 2026 formula gives a closer match to a lab result than the GMI your app shows.
Most likely around 5.3%. A GMI of 5.8% means an average of about 104 mg/dL, and the updated 2026 GMI turns that into an expected lab A1C of 5.3%, usually somewhere between 4.8% and 5.8%. A GMI of 5.8% on its own doesn't mean prediabetes.
For someone managing diabetes, it's well under the common 7% goal. A GMI of 6.2% points to a lab A1C of about 5.9%, which falls in the prediabetes range if you don't have diabetes. Only a lab test can confirm that, so ask your doctor rather than going by GMI alone.
A GMI of 7.0% points to a lab A1C of about 7.0%, right at the ADA's under-7% goal for many adults with diabetes. That goal is personal, though. Some people aim lower and some higher, and your time in range and your lows matter as much as the single number.
No. GMI is calculated from your CGM's average glucose, while HbA1c is measured in a lab from your red blood cells. In the study that created GMI, the two differed by 0.5 points or more in 28% of people. That's why a calculator that estimates your lab result is more useful than reading GMI as A1C.
GMI (mmol/mol) = 12.71 + 4.70587 × average glucose in mmol/L. The answer is in mmol/mol, not %. An average of 8.5 mmol/L gives about 53 mmol/mol, which equals a GMI of roughly 7.0%. The calculator accepts both units and switches between them for you.
At least 14 days, with the sensor active 70% of the time, according to the ADA's 2026 Standards. The 2018 GMI paper says 10 to 14 days is usually enough for a stable average. For the gap tab, the study behind it used about 60 days before each lab test.
Have clinical or research experience with this calculator? If you spot an error in the formula, the thresholds or the sources, or you would like to contribute to this page, write to partnerships@healthcalculator.io.
Sources
Figures on this page come from peer-reviewed studies and official guidelines, plus our own calculations from published formulas. One source is a 2026 conference abstract and is marked as one. Last verified November 2026.