Body Recomposition Calculator
Published:

Written by
Muhammad Hamza
, Founder & Content Researcher
Muhammad Hamza is the founder of Health Calculator, dedicated to building accurate and easy-to-use health tools for everyone.
Published:
Muhammad Hamza is the founder of Health Calculator, dedicated to building accurate and easy-to-use health tools for everyone.
This body recomposition calculator works out what to eat to lose fat and build muscle at the same time, then tells you how long it will take to reach the body fat you are aiming for. It runs the 2023 NASEM energy equations, and it holds your deficit under the line where a meta-regression found that gains in lean mass stop: about 500 calories a day.
Four numbers and three dropdowns.
About that activity dropdown. It changes your answer more than anything else on the page, so the options use NASEM's own descriptions rather than gym-speak. Low active is the default because it fits most people who lift a few times a week and sit down for work. Pick Active only if you really do move for about two hours a day.
Here is the finding that should shape your expectations, and almost nobody quotes it.
A 2022 meta-analysis pooled every randomized trial of at least three weeks where people lifted weights in a calorie deficit. Lean mass gains were clearly worse in a deficit than in a control group eating at maintenance (effect size −0.57, p = 0.02). Strength gains were not (−0.31, p = 0.28). The meta-regression then put a number on it: a deficit of about 500 calories a day prevented gains in lean mass altogether.
Two things follow from that, and they are the honest version of every recomp promise you have read:
Higher body fat and less training history are what tip the odds in your favor, which is why the calculator rates your potential from your body fat, your age and how long you have been lifting. If you are already lean and experienced, it will tell you that separate phases will probably serve you better. That is not the answer most tools give, and it is the true one.
Almost every recomposition calculator online starts with the Mifflin-St Jeor equation from 1990, works out your resting metabolic rate, then multiplies it by an activity factor. This one does not. It uses the 2023 NASEM total energy expenditure equations, built on doubly labeled water measurements, which estimate what you actually burn in a day in one step instead of guessing a multiplier.
You can check that it is implemented correctly, which is not something you can usually do with a calculator. The NASEM report publishes its own worked example: the average adult man in its database, 50.3 years old, 175.9 cm and 83.1 kg at an active level, should come out at 2,930 calories. Enter him here and this calculator returns 2,929. The average woman, 53.9 years, 162.3 cm, 71.9 kg, should be 2,281. It returns 2,281.
Activity level is where most of the movement is. Same man, 28 years old, 5'10", 190 pounds, only the dropdown changed:
| Activity level (NASEM category) | Maintenance calories |
|---|---|
| Inactive | 2,820 |
| Low active | 3,040 |
| Active | 3,230 |
| Very active | 3,600 |
That is a 780 calorie spread from one dropdown, which is why the labels are worth reading twice.
Now the part no other recomposition calculator will tell you, and the reason this page exists.
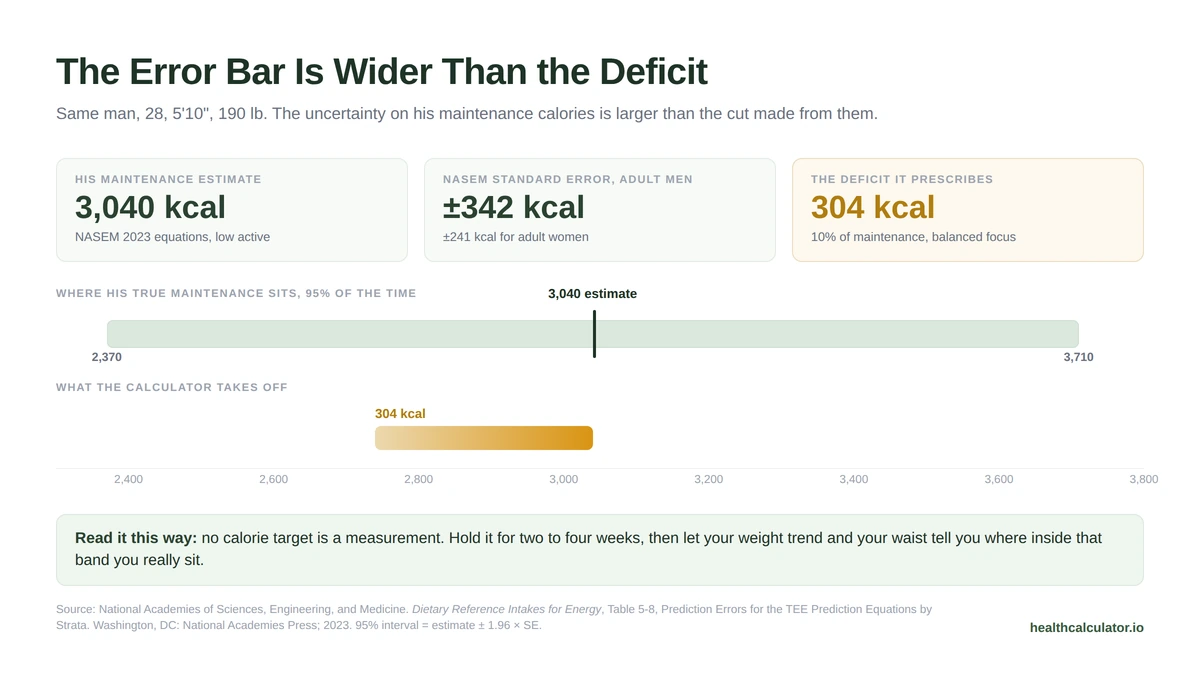
NASEM publishes the uncertainty on its own equations. For adults, the standard error of the predicted value is 342 calories for men and 241 for women. Run the 95% interval on our example man and his true maintenance sits somewhere between 2,370 and 3,710 calories.
Read that next to his prescription. A balanced recomp puts him 10% below maintenance, which is 304 calories.
His deficit is smaller than the error bar on the number it was subtracted from. That is not a flaw in this calculator; it is true of every calorie calculator ever built, and the others simply do not mention it. It has one practical consequence, and it is the most useful thing on this page:
The calorie number is a starting point, not a measurement. Hold it for two to four weeks, weigh yourself the same way each morning, take a waist measurement, and let the trend tell you whether the estimate was high or low. Then move by 100 to 200 calories. The scale and the tape measure are data. The calorie estimate is a hypothesis.
The three focus settings all resolve to a deficit, and here is exactly what each one does, because the trade-off is not obvious:
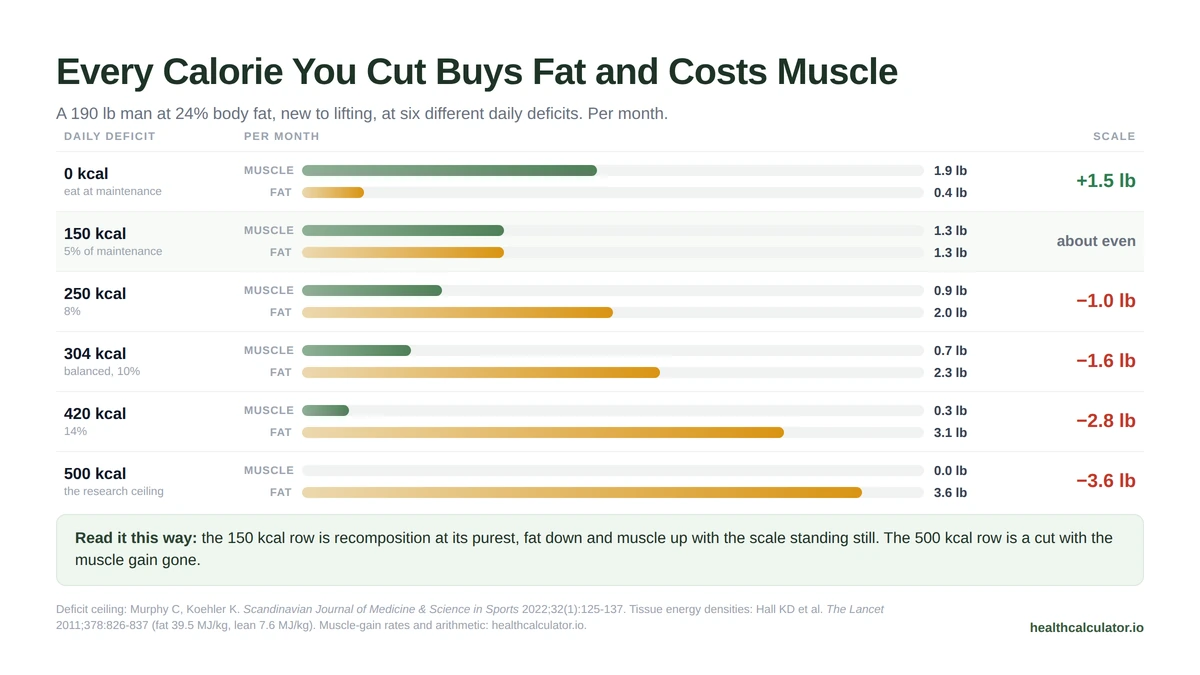
What those numbers buy, for a 190 pound man at 24% body fat who is new to lifting:
| Daily deficit | Muscle per month | Fat per month | Scale per month |
|---|---|---|---|
| 0 | 1.9 lb | 0.4 lb | +1.5 lb |
| 150 | 1.3 lb | 1.3 lb | about even |
| 250 | 0.9 lb | 2.0 lb | −1.0 lb |
| 304 (balanced) | 0.7 lb | 2.3 lb | −1.6 lb |
| 420 | 0.3 lb | 3.1 lb | −2.8 lb |
| 500 (the ceiling) | 0 lb | 3.6 lb | −3.6 lb |
Notice the row where the scale barely moves. That is textbook recomposition, and it is also the row where you will be most tempted to quit, because nothing appears to be happening. Take a photograph instead.
A man, 28, 5'10", 190 pounds, 24% body fat, aiming for 15%. Balanced focus, new to lifting, three lifting days, low active.
Look at the 12-week line. He loses 6.4 pounds of fat and gains 2.0 pounds of muscle, but the scale only shows 4.4 pounds gone. Anyone judging that by body weight alone would conclude it half worked.
Protein is the number to defend when calories come down, which is why it is set from your goal weight rather than your current weight. Our protein calculator works it out on its own if you want a second opinion.
Enter a waist measurement and the calculator runs a second check that has nothing to do with calories. It divides your waist at the navel by your height, the measure the UK's health guideline body now recommends alongside BMI. The body roundness index calculator reads those same two numbers against bands set by age and sex, rather than one cutoff for everyone.
The rule is easy to remember: keep your waist under half your height. At 5'10" that means under 35.0 inches. NICE sorts the result into three bands, 0.4 to 0.49 as healthy, 0.5 to 0.59 as increased risk, and 0.6 or more as high risk.
Here is the part almost every site quoting those bands leaves out. NICE applies them only below a BMI of 35. Above that, waist-to-height stops being the right instrument and the guideline sends you to BMI class instead. So if your BMI is 35 or higher, this calculator shows your ratio but withholds a risk label it cannot support. Most tools print it anyway.
Why this belongs on a recomposition page: the scale is the one number a successful recomp will not move. Your waist is. Measuring it at the same spot every four weeks is the cheapest progress check you have, and it doubles as the health check.
The second row uses the American Council on Exercise body fat categories, which put 18 to 24% in the average band for men and 25 to 31% for women. Those are fitness-industry bands rather than clinical ones, and the calculator labels them as ACE's for that reason.
We put the same man through every working recomposition calculator on page one of U.S. Google results on September 23, 2026.
| Calculator | Maintenance | Daily target | Protein | Can it tell him when he hits 15%? |
|---|---|---|---|---|
| This calculator | 3,040 (NASEM 2023) | 2,740 | 155 g | Yes: 8 months |
| fatcalc | 2,851 (Mifflin-St Jeor 1990 × 1.55) | 2,566 | 155 to 207 g | No, a fixed 12-week projection |
| Stronger | 2,725 (Katch-McArdle) | 2,590 | 175 g | No, 12-week ranges |
| Healthy Eater | not shown | 2,290 average | 180 g | No |
| Built With Science | no calculator on the page | n/a | n/a | No |
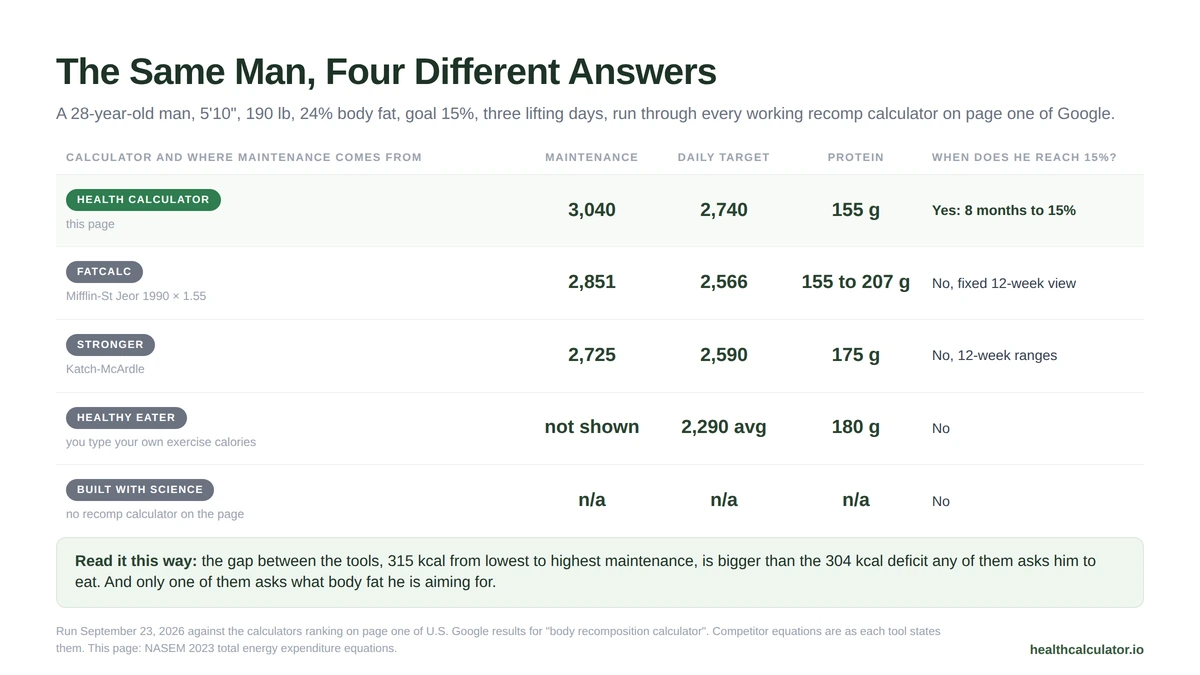
A 450 calorie spread in what he is told to eat, and four different answers about protein. None are arithmetic mistakes; they are different equations and different assumptions, all defensible. What none of them will do is ask what body fat you are aiming for, which is why none can answer the question people actually arrive with.
This calculator is for informational and screening purposes only and does not constitute medical advice or diagnosis. Always consult a qualified healthcare professional.
Yes, in a small deficit. A 2022 meta-analysis found lean mass gains are reduced when you train in a deficit but not erased, and that about 500 calories a day stops them completely. The odds are best if you carry more body fat and lift less. This body recomposition calculator holds your deficit under that ceiling.
It depends on how far you are from your goal, not on a fixed program length. Our example man, 190 pounds at 24% aiming for 15%, needs about 8 months on a balanced deficit. Expect roughly a point of body fat a month, a little faster as you get lighter. The calculator gives your own figure, not a generic 12-week window.
Long enough to see a clear change, rarely long enough to finish. In 12 weeks our example man loses 6.4 pounds of fat and gains 2.0 pounds of muscle, moving from 24% to 21.1%. That is about a third of the way to 15%. Judge it by your waist rather than the scale.
Around 10% of your maintenance calories if you want both halves working, and never more than 500 calories a day, because that is where the research shows lean mass gains stop. For a 3,040 calorie man that is roughly 300 calories. Bigger deficits are not wrong, they just buy faster fat loss with muscle you would otherwise have gained.
Under 0.5, which is the same as keeping your waist under half your height. NICE puts 0.4 to 0.49 in the healthy band, 0.5 to 0.59 at increased risk, and 0.6 or more at high risk. Those bands apply only below a BMI of 35. At 5'10" the line is a 35-inch waist.
The method is the same, the numbers are smaller. Women get their own NASEM equations, a goal floor of 14%, and expected muscle gain at about half the male rate. The 500 calorie ceiling matters more, because a smaller maintenance means a 20% deficit lands closer to it. A woman at 1,860 maintenance gets 420, or 23%.
No. Pick a tape option and the calculator estimates it: the waist-only equation needs weight and your waist at the navel, the Navy method needs neck and waist, plus hips for women. Expect more error, since tape estimates typically miss a DXA reading by about 4 points. Our body fat calculator runs four methods.
Every figure on this page is drawn from government reports, clinical guidelines or peer-reviewed research. Last verified September 2026.