FFMI Calculator
Published:

Written by
Muhammad Hamza
, Founder & Content Researcher
Muhammad Hamza is the founder of Health Calculator, dedicated to building accurate and easy-to-use health tools for everyone.
Published:
Muhammad Hamza is the founder of Health Calculator, dedicated to building accurate and easy-to-use health tools for everyone.
This FFMI calculator turns your height, weight and body fat into a fat-free mass index, then shows how much lean tissue you carry compared with the average adult. It also flags the one line on the page a doctor would recognize: under 17.0 for men or 15.0 for women, where clinical criteria start calling muscle mass low.
You need three numbers and one decision.
Tell it how you know your body fat. Got a reading from a DXA scan, an InBody or other bioimpedance scale, a Bod Pod or calipers? Choose "I know my body fat %" and pick the device. No number? Choose a tape option.
Enter your sex, height and weight. Imperial is the default. Tap Metric for centimeters and kilograms.
Hit Calculate. You get your FFMI, a plain verdict against the average adult, normalized FFMI, fat-free mass and fat mass index, plus an optional second comparison against people who train.
Which tape option? The waist-only tape needs your weight and your waist at the belly button. The neck-and-waist method uses the Hodgdon-Beckett equation, with hips added for women.
Why the calculator asks what measured you: a scan and a scale do not return the same lean mass, so the second comparison uses the group measured the way you were. Bod Pod, caliper and other readings use the bioimpedance group, which is our call, not the study's.
This calculator uses three yardsticks, because they answer different questions.
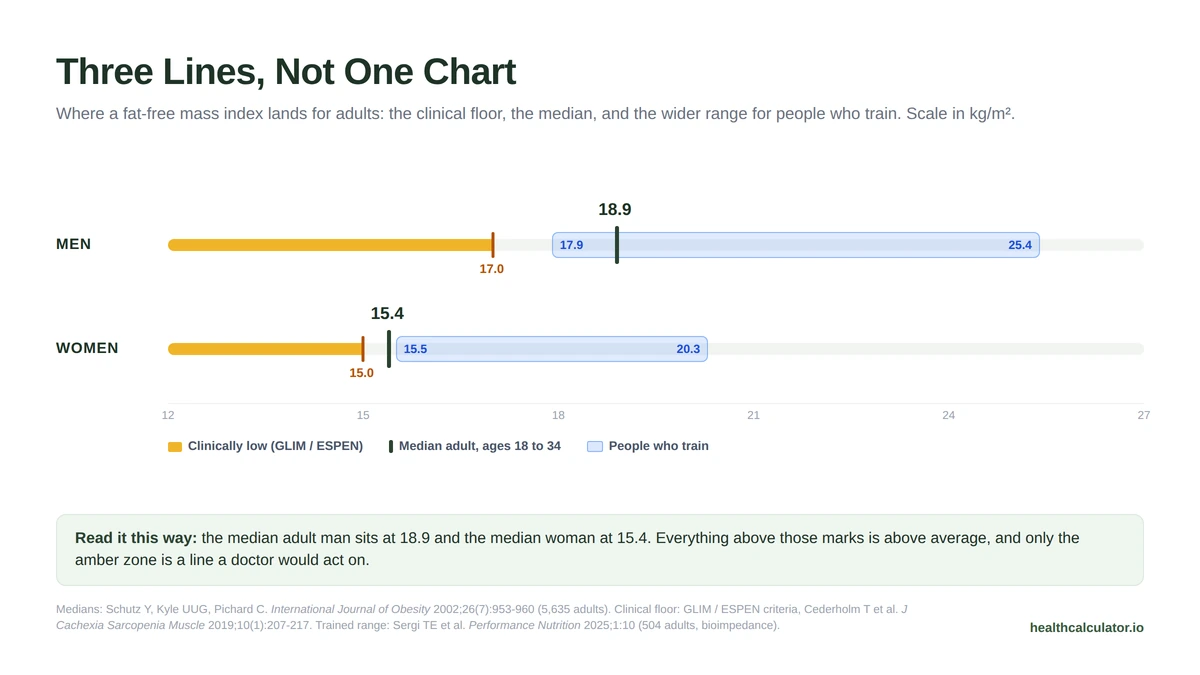
The average adult. The median FFMI at ages 18 to 34 is 18.9 for men and 15.4 for women, from bioimpedance readings on 5,635 adults. That is the "am I average?" line, and it is the one the headline verdict uses.
A clinical floor. Below 17.0 for men or 15.0 for women, the GLIM and ESPEN criteria count muscle mass as low enough to matter medically. Only there does the calculator tell you to see a doctor.
People who train, optionally. A 2025 study measured 504 active-duty personnel by scan, scale and tape. Their range is a tougher bar than average and it sits in the detail line, not the verdict, because a screened and trained group is not the general public.
Most people land above the clinical floor and near the median. That is normal, not mediocre.
FFMI, or fat-free mass index, is your fat-free mass in kilograms divided by your height in meters squared (kg/m²). Fat-free mass is everything that isn't fat: muscle, bone, organs and water. Think of FFMI as BMI with the fat taken out. It tracks how much lean tissue you carry for your height, not how much you weigh.
The calculator also shows your fat mass index (FMI), the same idea applied to fat. The two add up to your BMI, which is exactly why BMI can't tell muscle from fat.
Take a 5'10" man at 180 pounds. His BMI is 25.8, which the CDC classes as overweight. At 15% body fat, that 25.8 splits into 21.95 from fat-free mass and 3.87 from fat. Mostly lean tissue, in other words. Curious about your own BMI? Our BMI calculator takes ten seconds.
The calculator runs these steps:
Worked example, run on this page on September 29, 2026: a man, 5'10" (1.778 m), 180 lb (81.6 kg), 15% body fat from an InBody scale.
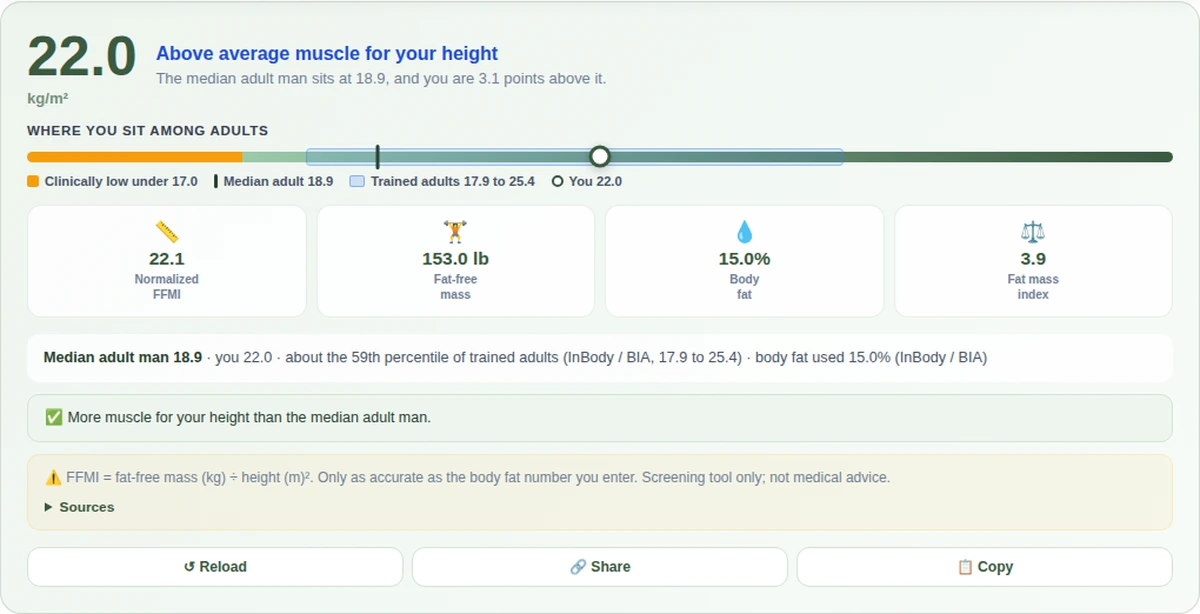
The calculator returns 22.0 and calls it above average muscle for his height, 3.1 points over the median adult man. Its second line puts him at about the 59th percentile of the trained group measured on the same kind of scale. Switch the dropdown to DXA and the verdict does not move, but that second figure jumps to the 78th.
Seen 6.3 in other FFMI calculators? Here's why. The abstract of Kouri's 1995 study prints 6.3. The Methods section, where the number is actually worked out, reports a slope of 6.1 kg/m³ from the drug-free athletes with an FFMI of 22 or higher, pegged to 1.8 meters, the average height of the drug-free group. We use the derived 6.1.
Why adjust for height at all? Kouri noticed taller men scored higher without looking more muscular. His shortest drug-free athlete (1.59 m) had an FFMI of 23.5 and one of the tallest (1.93 m) had 25.4, yet the shorter man looked more muscular. By our math, the correction puts them at 24.8 and 24.6.
The good news? Between 5'0" and 6'6", the 6.1 versus 6.3 gap never reaches 0.06 points. Your body fat number matters far more.
Most FFMI charts online don't say where their numbers come from. This one does, and it says what they are not.
| Line | Men | Women |
|---|---|---|
| Clinically low (GLIM and ESPEN) | under 17.0 | under 15.0 |
| Median adult, ages 18 to 34 | 18.9 | 15.4 |
| Mean in a second, separate sample | 18.6 | 15.7 |
That last row is the reason to trust the one above it. The medians come from 5,635 adults in Switzerland; the means come from 8,959 adults measured on a different continent. Two independent samples, both by bioimpedance, landing within 0.3 points of each other on both sexes.
Optionally, the tougher bar. These are the ranges from the 504 trained adults, and they change with the instrument:
| Measured by | Men, typical range | Women, typical range |
|---|---|---|
| DXA scan | 17.1 to 23.7 | 14.5 to 19.3 |
| InBody or other bioimpedance | 17.9 to 25.4 | 15.5 to 20.3 |
| Tape measure | 18.3 to 24.9 | 14.7 to 20.4 |
Two things move these numbers more than almost any FFMI page admits.
The instrument. Look down the DXA row. It sits about 1.2 points below bioimpedance in men and about 1 point below in women. Same bodies, same study, different machine.
Ancestry. In the 8,959-adult study, mean FFMI ran from 17.8 in Bouyei men to 19.4 in Uygur men. A 1.6 point spread between two groups inside one country, which is most of the distance from average to athletic. The authors' own conclusion is that separate reference values are needed for those populations.
So treat any single FFMI chart, including this one, as a marker rather than a standard. The trend on your own device is worth more than your position on anybody's table.
Short answer: it's a useful flag, not a wall.
The number comes from Kouri's study of 157 male athletes. The 74 who had never used steroids, including natural bodybuilding competitors, topped out at a normalized FFMI of 25.0. Many of the 83 users went past it, some beyond 30. Twenty Mr. America winners from 1939 to 1959, before steroids, averaged an estimated 25.4.
Three details most FFMI pages skip:
So if your normalized FFMI reads 25 or more, question your body fat number first. A reading that's too low pushes FFMI up, and the tape equations tend to read men too low (more on that below).
Women get no Kouri line at all, because his study included only men. The female athlete studies reviewed in the 2025 paper put "high" at roughly 19.0 to 19.7, close to the top of the trained ranges above.
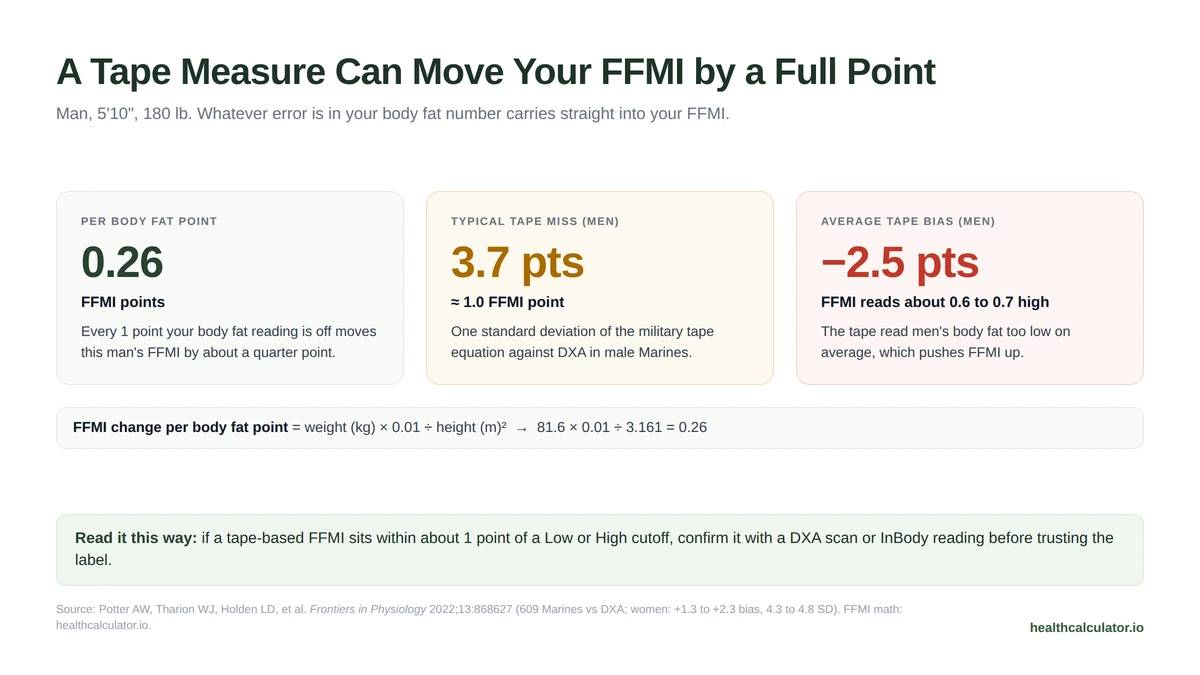
Here's the math most calculators skip. Every point of body fat error moves your FFMI by your weight in kilograms × 0.01 ÷ your height in meters squared. For our 5'10", 180-pound man, that's 0.26 FFMI points per body fat point.
Now the real-world error. When 609 Marines were checked against DXA, the circumference equation read men's body fat about 2.5 points too low on average, with a typical miss of 3.7 points. For women it read 1.3 to 2.3 points too high, with typical misses of 4.3 to 4.8 points. The authors' verdict: fine for screening, not research-grade data.
Put the two together. For our example man, a typical tape miss is worth about one full FFMI point, and the average bias alone inflates his FFMI by about two-thirds of a point.
What to do with that:
Prefer a target in pounds? The calculator doubles as a fat-free mass calculator, and the math runs backward too: multiply the FFMI you want by your height in meters squared. Here's the fat-free mass each FFMI takes, in pounds.
| Height | FFMI 16 | FFMI 18 | FFMI 20 | FFMI 22 | FFMI 25 |
|---|---|---|---|---|---|
| 5'2" | 87 | 98 | 109 | 120 | 137 |
| 5'4" | 93 | 105 | 117 | 128 | 146 |
| 5'7" | 102 | 115 | 128 | 140 | 160 |
| 5'10" | 112 | 125 | 139 | 153 | 174 |
| 6'0" | 118 | 133 | 147 | 162 | 184 |
| 6'3" | 128 | 144 | 160 | 176 | 200 |
Our 5'10" example carries 153 pounds of fat-free mass. Going from 22 to 25 would take about 21 more pounds of it. If you land below the median, the tip tells you how many pounds would put you at it, and our protein calculator sets a daily target while you build.
Building that while fat comes off at the same time? Our body recomposition calculator puts a monthly rate on both halves and shows the deficit where they stop working together.
We ran the same man (5'10", 180 pounds, 15% body fat) through FFMI calculators from Google's first page of U.S. results for "ffmi calculator" on September 22, 2026. The math barely differs. The verdicts are all over the place.
| Calculator | His FFMI | What it called him | What the label is based on |
|---|---|---|---|
| This calculator | 22.0 (normalized 22.1) | Above average muscle for his height, 3.1 points over the median adult man | Medians from 5,635 adults, corroborated by a second sample of 8,959, plus the clinical floor |
| Built With Science | 22 | "Fitness Model," more muscular than 95% of Americans | U.S. survey data from 1988 to 1994 (NHANES III) |
| Omni Calculator | 22 (normalized 22.1) | "Above average" | A category table with no study named |
| FFMICalculator.org | 22 (normalized 22.14) | 22 to 23 is "Excellent" on its scale | No study named; uses the 6.3 constant |
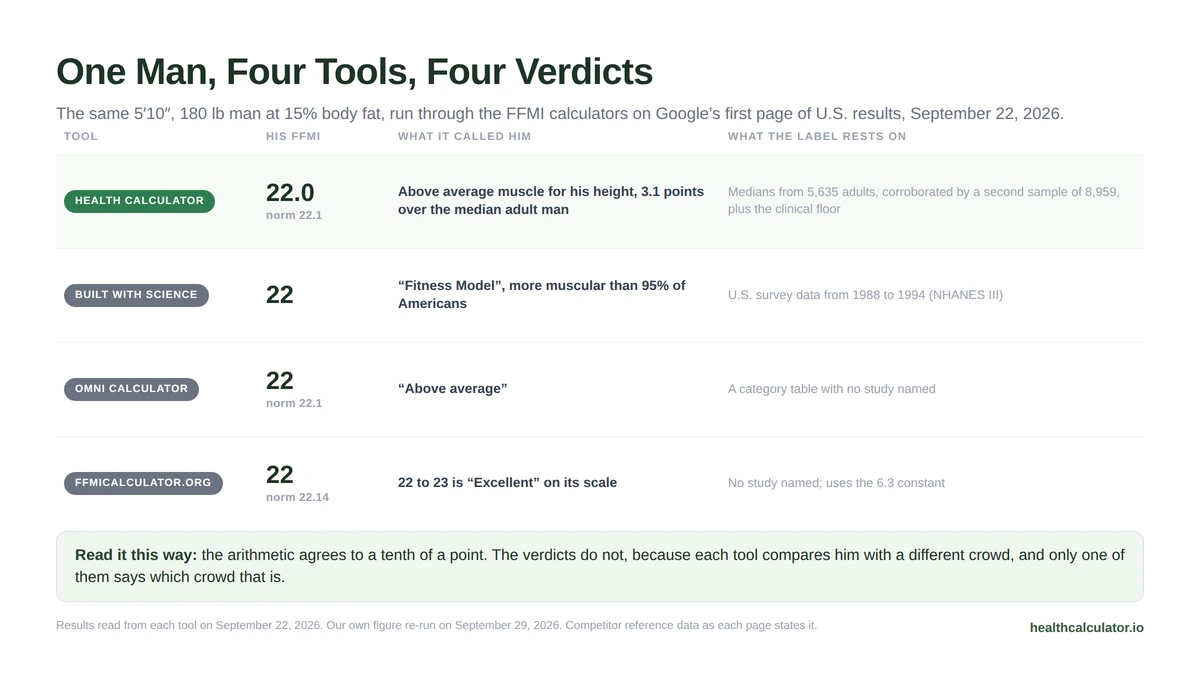
None of these are math mistakes. They compare him with different crowds: U.S. adults surveyed three decades ago, or a scale with no named data behind it. This calculator names its reference, shows a second sample that agrees with it, and is the only one that estimates body fat from a tape.
Use your result to track progress. If you're worried about low muscle mass or unexplained weight loss, talk to a doctor.
This calculator is for informational and screening purposes only and does not constitute medical advice or diagnosis. Always consult a qualified healthcare professional.
The median adult aged 18 to 34 sits at 18.9 for men and 15.4 for women, and a separate study of 8,959 adults found almost the same. Below 17.0 for men or 15.0 for women counts as clinically low muscle. This FFMI calculator places you against both lines.
It can be. In Kouri's 1995 study, drug-free male athletes topped out at a normalized FFMI of 25.0, and pre-steroid Mr. America winners averaged an estimated 25.4. That line came from skinfold body fat in 74 men, though. If you read 25 or higher, double-check your body fat number before drawing conclusions.
For a man, yes: 2.1 points above the median adult, and about the 43rd percentile of the trained reference group on a bioimpedance reading. For a woman, 21 is exceptional, above the 90th percentile of that same group. Either way, track the trend on one device rather than chasing a single reading.
The median adult woman aged 18 to 34 sits at 15.4, and a separate sample of 8,959 adults put the mean at 15.7. Below 15.0 counts as clinically low. Women carry less fat-free mass than men of the same height, so always compare with female figures, never a men's chart.
Normalized FFMI adjusts your score to a height of 1.8 meters (about 5'11") because taller people score slightly higher at the same muscularity. The formula adds 6.1 × (1.8 − your height in meters). Use normalized FFMI when comparing with Kouri's 25 limit, and plain FFMI for everything else.
Yes. Choose the waist-only tape (weight plus waist at the navel) or the neck-and-waist method (neck and waist, plus hips for women). The calculator estimates your body fat first. Expect more error: in Marines, the tape typically missed a DXA reading by about 4 points.
Every figure on this page is drawn from government health statistics or peer-reviewed research. Last verified September 2026.