Dr. Farah Taqueer is a pediatrician based in Karachi with more than 14 years of clinical experience. She qualified with an MBBS from Liaquat University of Medical and Health Sciences and holds an MD in Pediatrics, and is registered with...
High blood sugar pulls water into your bloodstream and dilutes your sodium, so a low reading during hyperglycemia is often not a real sodium problem. This corrected sodium calculator runs all five correction equations in clinical use, because they disagree with each other, and shows you exactly where that disagreement starts to change the answer.
Enter your sodium and glucose in the calculator. Then read on, because the corrected number only means something if you have the right kind of low sodium in the first place.
Why High Blood Sugar Lowers Your Sodium
Glucose that cannot get into cells stays in the blood and acts as an osmotic pull. Water follows it out of the cells and into the bloodstream. More water, same amount of sodium, so the concentration falls.
This is real dilution, not a lab error. Your sodium genuinely is low at that moment. What the correction estimates is where it would sit once the glucose is treated and the water goes back where it belongs.
The catch is that this only describes one of three different reasons a sodium result comes back low, and the formula is wrong for the other two. More on that below.
The Corrected Sodium Formula
You will be quoted two. There are at least five in clinical use.
Both are quoted verbatim from MDCalc's published evidence for this calculation. In plain terms, Katz says sodium drops 1.6 mEq/L for every 100 mg/dL of glucose above 100. Hillier says 2.4. The other three, and why they matter, are further down.
Where 1.6 and 2.4 came from
Katzcalculated 1.6 in 1973. He did not measure it. Based on theoretical modelling he argued the rule of thumb in use at the time, 2.8, overstated the dilution, because hyperosmolality persists and less water leaves the cells than that rule predicted. His smaller number is what every textbook printed for the next twenty-six years.
Nobody tested it until 1999, when Hillier and colleagues blocked insulin secretion in 6 healthy volunteers, pushed glucose above 600 mg/dL and brought it back down while sampling sodium every ten minutes.
What they found was not a single number. The relationship was not a straight line: 1.6 fitted well up to a glucose of 400 mg/dL, and above that a factor nearer 4.0 fitted better. The 2.4 you see quoted everywhere is the mean across the whole range, and Pathology is explicit that Hillier proposed it as a simplification that worked reasonably well at all glucose values. It is a practical compromise, not a physiological constant.
Six volunteers is a small experiment. It is also still the controlled experiment the field refers back to, and Pathology's 2025 verdict is that clinical texts continue to use Katz or Hillier without a clear preference of one over the other.
The worked example where they disagree
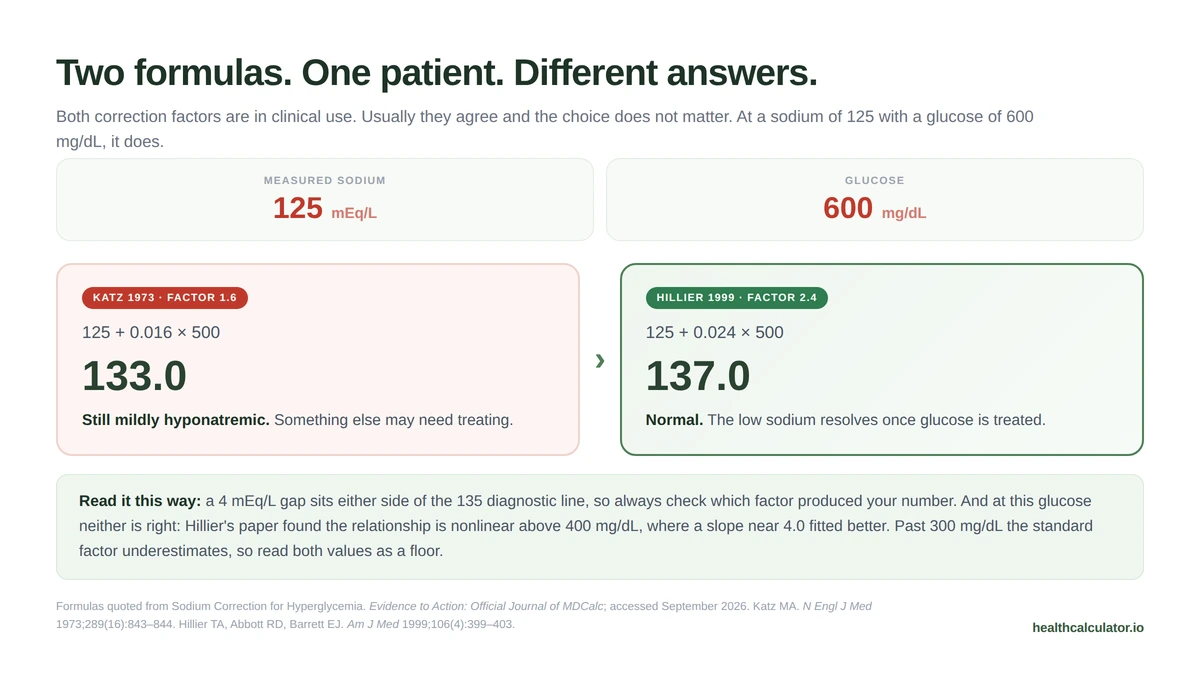
Most of the time both formulas land in the same place and the argument is academic. Sometimes they do not.
Take a measured sodium of 125 mEq/L with a glucose of 600 mg/dL.
Formula
The arithmetic
Corrected sodium
Verdict
Katz, 1.6
125 + 0.016 × 500
133.0
Still mildly hyponatremic
Hillier, 2.4
125 + 0.024 × 500
137.0
Normal
Same blood draw. One formula says the sodium problem persists after the sugar is fixed, the other says it resolves. That is not a rounding difference, it is a different clinical conclusion about whether anything else needs treating.
Our calculator runs both and flags it when they land on opposite sides of 135.
There Are Not Two Equations. There Are Five.
This is the part no calculator page carries, and it is the reason the number you were given may not match the number someone else calculates from the same blood draw.
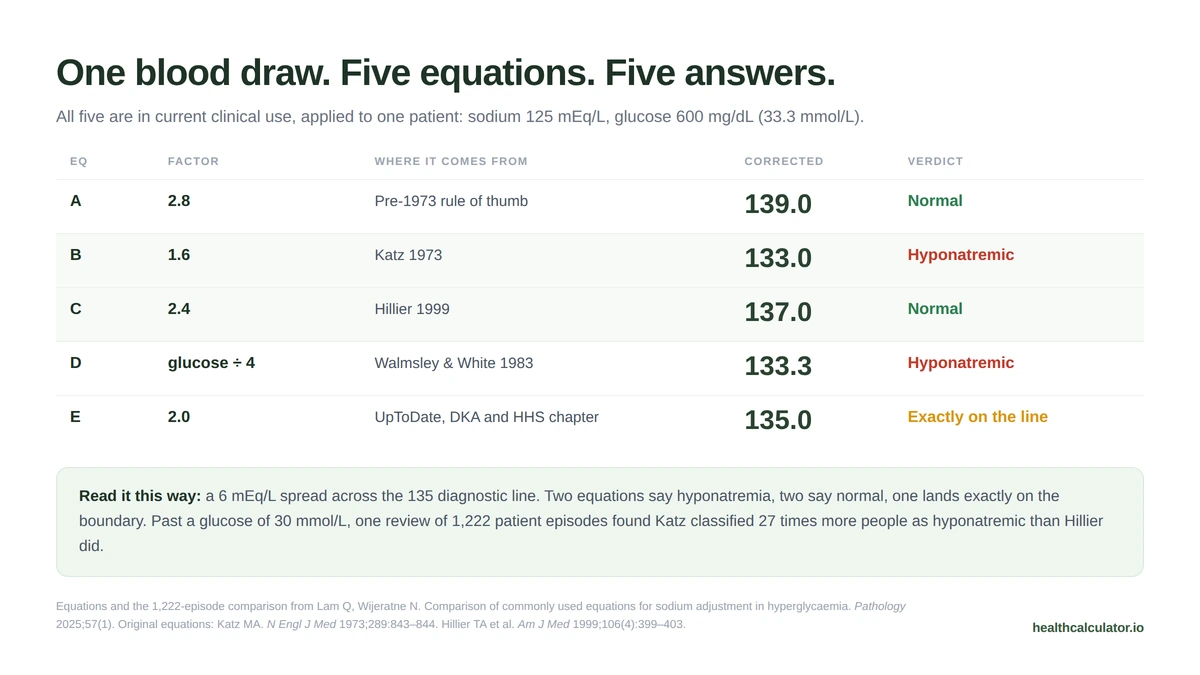
Lam and Wijeratne catalogued the equations actually in clinical use in their 2025 comparison in Pathology, the journal of the Royal College of Pathologists of Australasia. There are five. Here is what each one does to the same patient: sodium 125 mEq/L, glucose 600 mg/dL (33.3 mmol/L).
Equation
Factor
Where it comes from
Corrected sodium
Verdict
A
2.8
The pre-1973 rule of thumb
139.0
Normal
B
1.6
Katz 1973
133.0
Hyponatremic
C
2.4
Hillier 1999
137.0
Normal
D
glucose ÷ 4
Walmsley & White, 1983
133.3
Hyponatremic
E
2.0
UpToDate, DKA and HHS chapter
135.0
Exactly on the line
One blood draw. A 6 mEq/L spread. Two equations call it hyponatremia, two call it normal, and one lands precisely on the 135 boundary.
The calculator on this page runs all five, because knowing which one produced your number is the whole point.
Why they diverge, and exactly where
Below a glucose of 30 mmol/L, about 540 mg/dL, this argument mostly does not matter. Lam and Wijeratne found the four equations still in routine use agree within ±3 mmol/L, which is the Royal College of Pathologists of Australasia's allowable performance specification for sodium.
Above 30 mmol/L, they come apart. In 1,222 real patient episodes from a hospital laboratory over five years, at glucose values above that threshold:
Katz classified 27 times more people as hyponatremic than Hillier did
Hillier classified 1.7 times more people as hypernatremic than Katz did
Twenty-seven times. From the same blood draws, on the same patients, using two equations that contemporary clinical texts treat as interchangeable.
Our worked example sits at 600 mg/dL, above that threshold. That is not an accident. It is the range where the choice of equation stops being academic.
Across all 1,222 episodes, correction moved 41.6% of results out of the hyponatremic range down to 4.3%. It also tripled the proportion classified as hypernatremic, from 7.6% to 22.3%. Correction is not simply reassurance, it moves people in both directions, and that matters: Chuang and colleagues found 90-day mortality in severe hyperglycemia was higher at both ends, in those who stayed hyponatremic after correction and those who became severely hypernatremic.
Above 400 mg/dL, no equation is really right
Hillier's nonlinearity finding is what sits underneath all of this. Above a glucose of 400 mg/dL a factor nearer 4.0 fitted their data, and none of the five equations above uses 4.0. Nobody has published one that does.
American Family Physician stated the direction of that error plainly. The conventional 1.6 factor underestimated sodium in most cases once glucose passed 300 mg/dL, and in almost every measurement once it passed 500 mg/dL.
So, in practice: once glucose passes roughly 300 mg/dL, read every corrected value as a floor rather than an answer, and the higher the glucose, the more true that becomes.
A note on units
Sodium is reported in mEq/L or mmol/L and the two are numerically identical, which is why MedlinePlus prints it as 136 to 144 mEq/L (136 to 144 mmol/L). Nothing to convert.
Glucose is the one that changes. The US reports mg/dL, most of the rest of the world reports mmol/L.
Here is a small detail that turns out to matter. Sources convert 100 mg/dL of glucose to either 5.5 or 5.6 mmol/L, inconsistently. American Family Physician uses 5.6. Lam and Wijeratne point out that glucose has a molecular weight of 180.156 g/mol, so the true value sits between the two at 5.55 mmol/L, and they standardise on 5.55 specifically to remove that source of variation.
We use 5.55 for the same reason. In SI units the two published forms are:
Katz: sodium + 1.6 × (glucose − 5.55) ÷ 5.55, which clinicians shorten to (glucose − 5.55) ÷ 3.5
Both shortcuts come straight from the Pathology comparison and exist because they can be done at the bedside without a calculator. This calculator converts your figure and runs the full forms, so nothing gets rounded by hand. Paste straight off your report either way.
Which Kind of Low Sodium Do You Actually Have?
This is the part that decides whether the corrected number means anything, and it is missing from every calculator we checked.
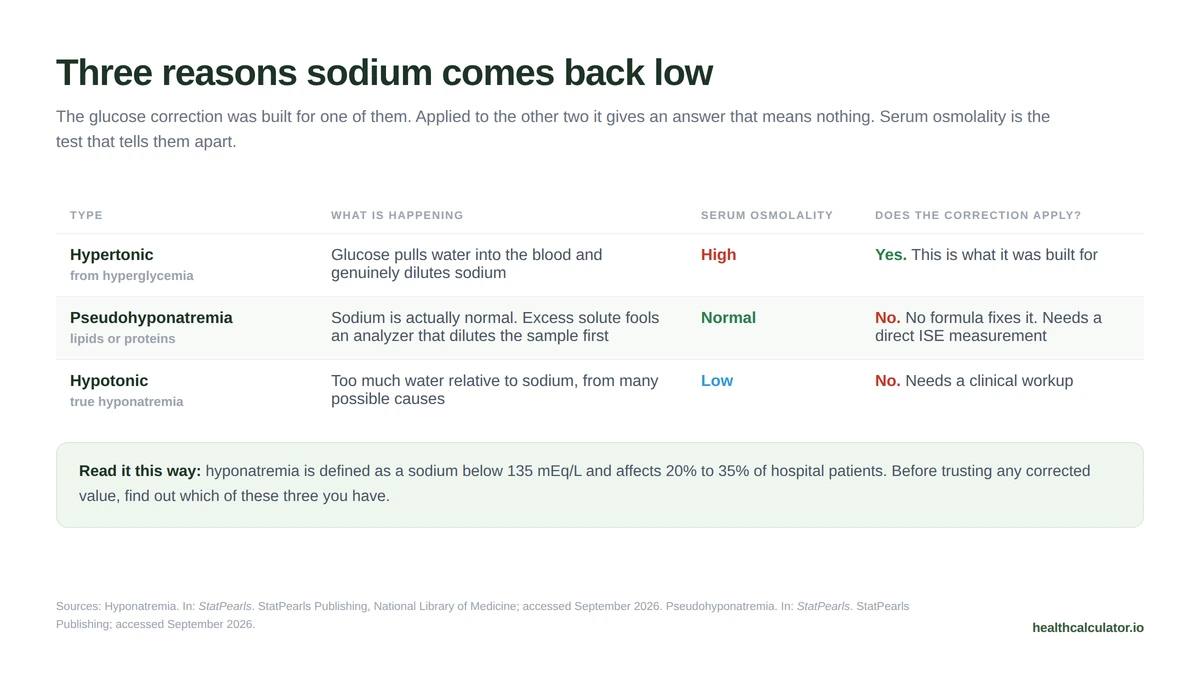
A sodium below 135 has three quite different explanations, and the glucose correction only applies to one of them.
What is happening
Serum osmolality
Does this formula apply?
Hypertonic, from hyperglycemia
Glucose pulls water into the blood and genuinely dilutes sodium
High
Yes. This is what the formula was built for
Pseudohyponatremia
Sodium is normal. Very high lipids or proteins fool the analyzer
Normal
No. No formula fixes this
True hypotonic hyponatremia
Too much water relative to sodium, from many possible causes
Low
No. Needs a clinical workup
Serum osmolality is what separates them, and it is a test your doctor can order alongside the sodium.
People search for one constantly, so here is the direct answer: it does not exist, and that is not an oversight.
Calcium has an albumin correction. The anion gap has one. Sodium does not, because the mechanism is completely different. If the reason you are here is a low albumin on the same panel, our guide to low albumin covers what it means on its own.
With calcium, albumin genuinely binds the mineral, so low albumin genuinely lowers the measured total. Arithmetic can estimate around it. With sodium, high protein or high lipid does not change the sodium at all. It changes how much of your blood sample is water, and an analyzer that dilutes the sample before measuring gets fooled by that.
So the fix is not a formula. It is a different measurement, usually on a blood gas analyzer, which uses the direct method. If you have very high triglycerides, very high cholesterol, or a paraprotein disorder such as myeloma, that is the conversation to have with your doctor.
If the albumin question brought you here, the tool you were probably looking for is our corrected calcium calculator.
Sodium Ranges and What They Mean
Sodium
Category
Notes
Below 125 mEq/L
Severe hyponatremia
Urgent evaluation
125 to 130 mEq/L
Moderate hyponatremia
Needs clinical assessment
130 to 135 mEq/L
Mild hyponatremia
Common, still worth explaining
136 to 144 mEq/L
Normal
Above 145 mEq/L
Hypernatremia
Usually a water deficit
Severity bands follow the StatPearls hyponatremia chapter and the normal range follows MedlinePlus. As always, your own laboratory's printed range wins over any of these.
The Part That Matters Most Is How Fast It Gets Corrected
Neither MDCalc's hyperglycemia tool nor Omni mentions this on the page, and it is the piece with the real consequences.
When sodium has been low for a while, the brain adapts. Raise it too quickly and you get osmotic demyelination syndrome, formerly called central pontine myelinolysis, which can cause seizures, disorientation, coma and in severe cases locked-in syndrome.
That is why this is a hospital decision, not a home one. It matters in diabetic ketoacidosis especially: as insulin brings glucose down, sodium rises on its own, and the corrected value tells the team roughly where it is heading.
If glucose control is the underlying issue, our A1C calculator shows your three-month average, and our eGFR calculator covers the kidney function that sits underneath most sodium handling.
Straight assessment: MDCalc is the better bedside tool and its evidence write-up on the Katz versus Hillier history is genuinely good. It also has a dedicated Sodium Correction Rate calculator, which is the right home for that math. The gap is that a worried person reading their own lab report has to find two separate tools and still will not learn that their low sodium might be pseudohyponatremia.
Omni explains the physiology clearly and is easy to use. It just stops at the arithmetic.
We built this one for the person holding the lab report.
Why Use Our Corrected Sodium Calculator
All five equations in clinical use, side by side, not just the two you usually get
A flag when Katz and Hillier land on opposite sides of the diagnostic line
A warning once glucose passes the point where the equations stop agreeing
Glucose in mg/dL or mmol/L, sodium in either equivalent unit
Tells you whether the correction even applies to your situation
No sign-up, nothing stored
When to Get Help Now
Low sodium with symptoms is urgent. Get same-day care for confusion, drowsiness, seizures, persistent vomiting, severe headache or unsteadiness, particularly if blood sugar is also high.
For a mildly low sodium with no symptoms, the sensible next step is a repeat panel with glucose and serum osmolality drawn at the same time. Your doctor decides what else is needed.
Corrected Sodium Is Not a Diagnosis
This calculator is for informational and screening purposes only and does not constitute medical advice or diagnosis. Always consult a qualified healthcare professional. The correction estimates what sodium would be at a normal glucose. It does not tell you why sodium is low, it does not apply to pseudohyponatremia or hypotonic hyponatremia, and decisions about correcting sodium belong in a clinical setting because correcting too fast carries serious risk.
Two are usually quoted. Katz 1973: sodium + 0.016 × (glucose in mg/dL − 100). Hillier 1999: sodium + 0.024 × (glucose − 100). MDCalc publishes both because the field has not settled on one. A 2025 comparison in Pathology catalogued five equations in clinical use, and this calculator runs all five.
There is no settled answer, and a 2025 review that tested them on 1,222 patient episodes said so explicitly: without mortality data it could not determine the clinical superiority of one equation. Below a glucose of 30 mmol/L, about 540 mg/dL, the choice barely matters. Above it, that same review found Katz classified 27 times more people as hyponatremic than Hillier did. Run both, which this calculator does, and take the gap to your doctor rather than picking one yourself.
Not reliably. Hillier found the relationship between sodium and glucose is nonlinear above 400 mg/dL, where a slope near 4.0 fitted better than 1.6 or 2.4. None of the five published equations uses 4.0, and nobody has published one that does. American Family Physician gave the direction of the error instead: the conventional factor underestimated sodium in most cases above 300 mg/dL and in almost all measurements above 500 mg/dL. Above roughly 300, read every corrected value as a floor rather than an answer.
Because they are not all running the same equation. Five are in clinical use: factors of 2.8, 1.6, 2.4 and 2.0, plus a shorthand that simply divides glucose by 4. At a sodium of 125 with a glucose of 600 mg/dL they return 139.0, 133.0, 137.0, 135.0 and 133.3, which straddles the 135 diagnostic line. Always find out which equation produced your number.
No, and there should not be. Calcium binds to albumin so arithmetic can estimate around it. Sodium does not. When high protein or lipid distorts a sodium result, the fix is a direct ion-selective electrode measurement, which needs no correction factor at all.
A sodium reading below 135 mEq/L alongside a normal serum osmolality of 280 to 300 mOsm/kg. Very high lipids or proteins fool analyzers that dilute the sample first. The sodium itself is fine, and the glucose correction formula does not apply.
Current guidance is no more than 10 mEq/L in the first 24 hours. Going faster risks osmotic demyelination syndrome, which can cause seizures, disorientation and coma. This is a hospital decision and this calculator does not attempt it.
Either, using the switch on the glucose field. The US reports mg/dL and most other countries report mmol/L, where 100 mg/dL is about 5.6 mmol/L. Sodium needs no switch because mEq/L and mmol/L are numerically identical for sodium.
Because the dilution reverses. As insulin moves glucose back into cells, the water that followed it into the bloodstream goes with it, and the sodium concentrates again. The corrected value estimates roughly where it will land, which is why treatment teams monitor the rate closely.
MedlinePlus gives 136 to 144 mEq/L, and notes that ranges vary slightly between laboratories. Below 135 is hyponatremia, graded mild at 130 to 135, moderate at 125 to 130 and severe below 125.
Sources
Every figure on this page is drawn from government health statistics or peer-reviewed research. Last verified September 2026.
Lam Q, Wijeratne N. Comparison of commonly used equations for sodium adjustment in hyperglycaemia. Pathology. 2025;57(1). Letter to the Editor, Royal College of Pathologists of Australasia. Source for the five-equation catalogue, the 5.55 mmol/L conversion, and the 1,222-episode comparison. The Walmsley & White (1983) and UpToDate equations are cited as catalogued in this paper.
Adjusting sodium levels in patients with hyperglycemia. American Family Physician. 1999;60(6):1821. Summary of the Hillier study, including the −2.4 ± 0.3 regression slope and the degree of underestimation above 300 and 500 mg/dL.
MedlinePlus. Basic metabolic panel. National Library of Medicine; accessed September 2026.
National Library of Medicine. Hyponatremia. In: StatPearls. StatPearls Publishing; accessed September 2026.
National Library of Medicine. Pseudohyponatremia. In: StatPearls. StatPearls Publishing; accessed September 2026.