BRI Calculator
Published:

Written by
Muhammad Hamza
, Founder & Content Researcher
Muhammad Hamza is the founder of Health Calculator, dedicated to building accurate and easy-to-use health tools for everyone.
Published:
Muhammad Hamza is the founder of Health Calculator, dedicated to building accurate and easy-to-use health tools for everyone.
Put your height and waist into the BRI calculator and it returns four things: your body roundness index, your estimated body fat, your estimated visceral fat, and the healthy range for someone your age and sex. In the 32,995-adult NHANES study that made this number famous, the link between roundness and death was U-shaped, which means a score can be too low as easily as too high.
Most calculators hand you one number and leave. This one gives you four, because roundness on its own does not tell you much until you know what it is made of.
| What you see | What it is | What moves it |
|---|---|---|
| Body roundness index | How close your body is to a sphere rather than a cylinder. Roughly 1 to 16. | Waist and height only. Weight does not enter it. |
| Body fat % | An estimate of total fat, from the equation published with the original model. | Age, sex, race, height, weight, waist. |
| Visceral fat % | An estimate of the deep fat packed around your organs. | Same inputs, plus hip if you tick that box. |
| Your healthy range | The band of roundness scores that maps to a healthy body fat range for your age and sex. | Age, sex, height. |
Two of those deserve a warning up front. The body fat and visceral fat figures are estimates from a regression equation, not measurements, and the visceral number in particular sits so low on the scale that it rarely leaves "normal" even for quite large bodies. If the visceral figure is what you came for, our dedicated visceral fat calculator runs a CT validated equation and reports an area in cm² you can read against published thresholds. Treat the roundness score and your healthy range as the working outputs. The other two are context.
Body roundness comes from treating your body as an ellipse. Your height is the long axis, your waist wraps the short one, and the formula measures how squashed that ellipse is:
BRI = 364.1724047 − 365.5249684 × √(1 − (waist ÷ (π × height))²)
That is the equation Diana Thomas and colleagues published in 2013, alongside the healthy ranges this page uses.
Here is the part almost nobody mentions. When the big NHANES mortality paper appeared in June 2024, the printed formula did not say which units to use. A month later the journal issued a correction titled "Error in Formula", stating that height and waist circumference must both go in using the same unit.
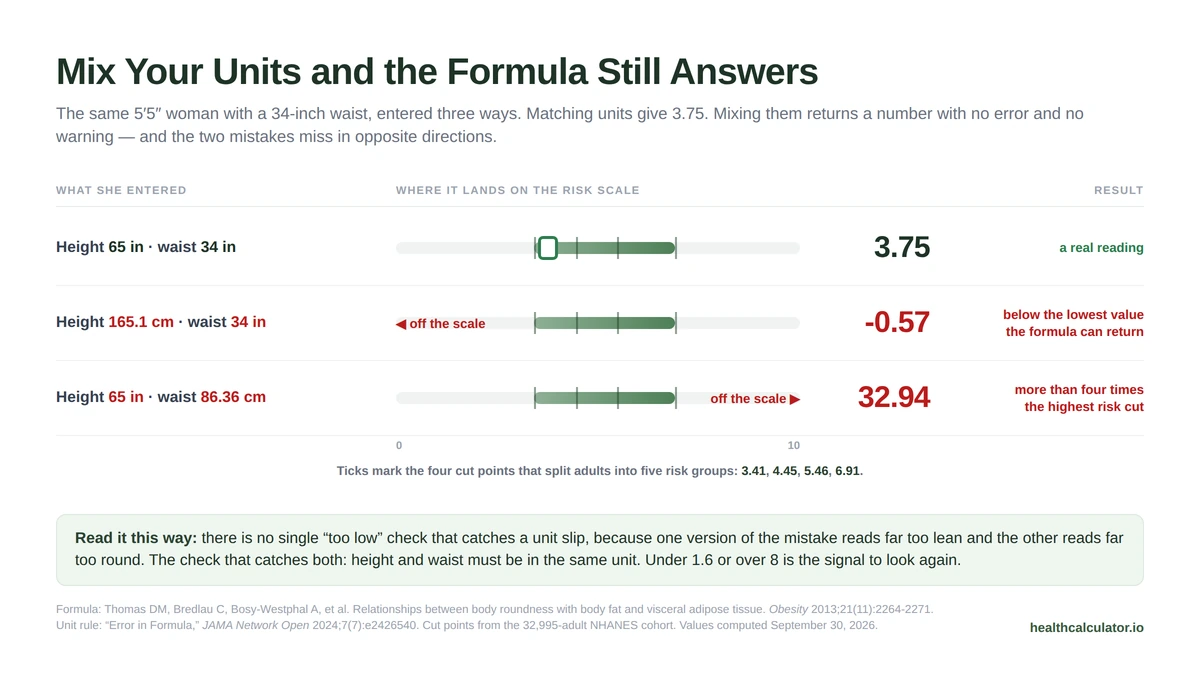
It sounds like a footnote. It is not. Because both measurements sit inside the same ratio, the formula is unit-free as long as you are consistent. A 5 ft 5 in woman with a 34 in waist scores 3.75 whether you feed it inches or centimeters. Mix them, though, and the answer does not just drift, it collapses:
| What you enter | Result |
|---|---|
| 165.1 cm height, 86.36 cm waist | 3.75 |
| 65 in height, 34 in waist | 3.75 |
| 165.1 cm height, 34 in waist | −0.57 |
That third row is the one to watch. It is not an error message, it is a plausible-looking low number, and on a calculator that reports quintiles it would file her in the group with the highest risk at the low end. This calculator converts everything to centimeters before it does any arithmetic, so the mix cannot happen here, but it is worth knowing why the field on this page is labeled the way it is.
The 2024 analysis followed 32,995 American adults for a median of about ten years and split them into five equal groups by roundness. The middle group was the reference.
| Group | BRI range | What the study found |
|---|---|---|
| Q1 | 1.05 to under 3.41 | 25% higher risk of death |
| Q2 | 3.41 to under 4.45 | No significant difference |
| Q3 | 4.45 to under 5.46 | Reference group |
| Q4 | 5.46 to under 6.91 | 25% higher risk |
| Q5 | 6.91 and above | 49% higher risk |
Read Q1 again. The lowest roundness group had elevated mortality, not the lowest. That is what "U-shaped" means, and it is the single most misreported fact about this metric. I have lost count of the BRI pages that label everything under 3.41 as "low risk" when the paper they are citing says the opposite.
Why would thin-waisted people die sooner? The usual explanation is reverse causation: illness, frailty and muscle loss shrink a waist, and it is the illness doing the killing. That does not make a low score a goal to chase. If your result lands in Q1 and you did not get there on purpose, it is worth a conversation rather than a celebration.
BMI asks how heavy you are for your height. Roundness asks where you carry it. The interesting cases are the ones where they split.
The split that matters most is the person whose BMI looks fine but whose waist does not. A BMI check waves them through while the tape says the fat is sitting around the organs, where it does the most metabolic damage. Roundness catches them because weight never enters the formula. It is waist and height, nothing else.
The reverse is just as real. A muscular person with a solid midsection reads round here while carrying very little fat, exactly as BMI overstates them. Neither number can tell a thick waist from a thick torso.
So do not pick a winner. Run both and pay attention when they disagree, because the disagreement is the finding. Our BMI calculator and body fat calculator are the natural pair alongside this one.
Every other body roundness calculator I could find prints one universal chart. This one does not. The original paper established healthy roundness ranges rather than a single cutoff, and this tool rebuilds that band from your age, sex and height instead of flattening everyone onto one line.
The practical effect is larger than you would guess. Here is the top of the healthy band, turned back into a waist measurement, for two typical builds:
| Person | Top of healthy band | Half their height |
|---|---|---|
| Man, 5 ft 10 in, age 30 | 33.2 in | 35.0 in |
| Man, 5 ft 10 in, age 50 | 35.2 in | 35.0 in |
| Man, 5 ft 10 in, age 70 | 37.8 in | 35.0 in |
| Woman, 5 ft 4 in, age 30 | 32.5 in | 32.0 in |
| Woman, 5 ft 4 in, age 50 | 33.5 in | 32.0 in |
| Woman, 5 ft 4 in, age 70 | 35.2 in | 32.0 in |
A 30-year-old man is held to a waist 4.6 inches tighter than a 70-year-old man of exactly the same height. That is not a bug. It reflects how the band is built: the healthy body fat range it maps from widens as you get older. But it does mean two people can get opposite verdicts from the same waist tape, and you should know which side of that line you are standing on.
One honest limitation while we are here: the bottom of the band is set so low that reaching it would take a waist of around 19 to 21 inches. In practice nobody sees "below your healthy range" on this tool, and you should not treat the band's floor as a target.
While building this page I checked all six bands against Table 4 of the source paper, which lists predicted body fat at three BMI thresholds: underweight, overweight and obesity. A healthy band should run from the underweight figure to the overweight one.
Five of the six did. The band for women aged 40 to 59 did not. It ran from 23% to 40%, and 40% is that row's obesityfigure. The overweight figure is 34%. One row too far down.
The effect was not small. A 45-year-old woman of 5 ft 5 in was being told a 38.1 inch waist was still healthy, when the paper puts her limit at 33.7 inches. At 38.1 inches her waist-to-height ratio is 0.59, which NICE classifies as increased health risk. The tool was calling a high-risk waist normal for roughly 4.4 inches of range.
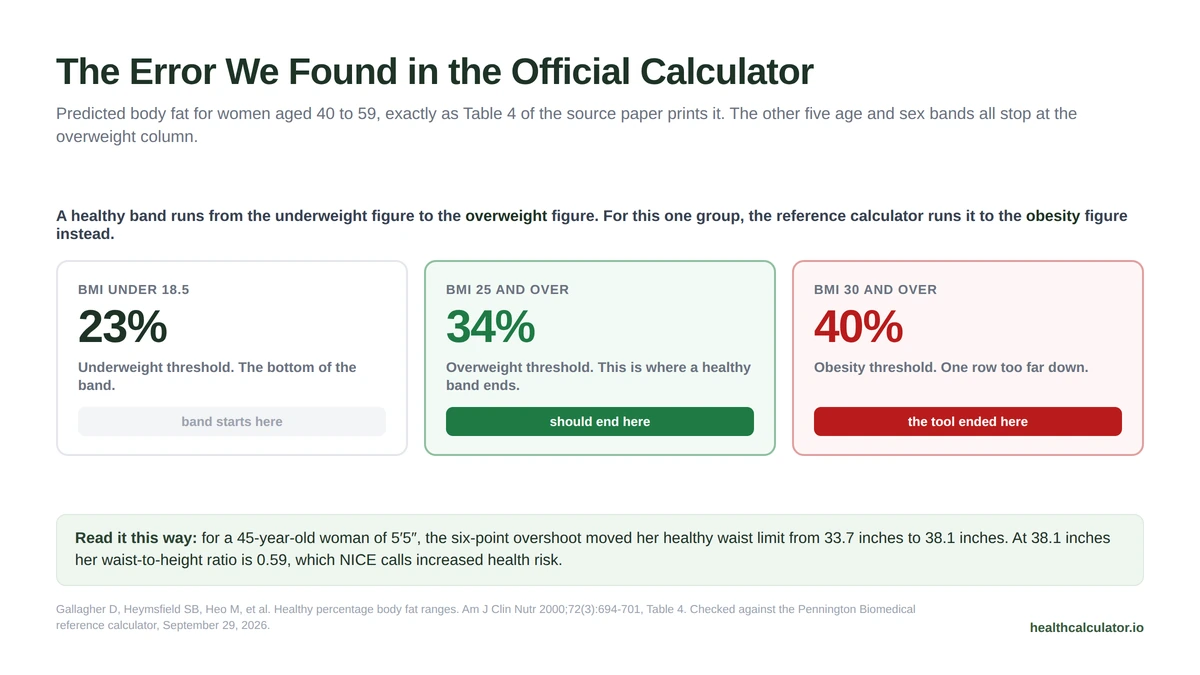
The reference calculator at Pennington Biomedical behaves the same way, which is how the error survived: checking a tool against another tool cannot catch a mistake both of them share. We corrected it here against the printed table, so this page and the official one now disagree for women in their forties and fifties. Ours follows the paper.
This is the part no other page explains, so here is a real run of this tool rather than a hypothetical.
Inputs, entered on this page on September 29, 2026: man, white, age 35, height 5 ft 10 in, waist 34 in, weight 180 lb.
What came back:
| Output | Value | Verdict |
|---|---|---|
| Body roundness index | 3.04 | Above his healthy range (band tops out at 2.85) |
| Risk group | Q1 | The group with 25% higher mortality |
| Estimated body fat | 23.4% | Above the 8 to 20% healthy range for his age |
| Estimated visceral fat | 2.0% | Normal |
| BMI | 25.8 | Overweight |
| Waist-to-height | 0.486 | Healthy |
One man, one tape measure, four different answers. His BMI calls him overweight. His waist-to-height ratio clears him, because the NICE threshold is a waist under half your height and 34 inches is comfortably under 35. His roundness band says he is over. And his quintile, the one most sites would print as "low risk", is the quintile where deaths went up.
So which is right? All of them, for different questions. NICE deliberately uses one simple line that works for everybody with a BMI under 35, and simplicity is the point of it. The roundness band is tuned to his age and sex, so it is stricter on a 35-year-old man than a blanket rule would be. The quintile is a population statistic, not a personal verdict.
What you should take from a split like this is direction, not a grade. Three of his four numbers point the same way: a 34-inch waist at 5 ft 10 in is fine by the national rule and a little high for a man in his thirties. That is a useful thing to know, and no single number would have told him.
A rounder-than-expected result is a reason to book a check-up and get blood pressure, lipids and glucose looked at. It is not a diagnosis, and this tool is not a substitute for one.
There is no single good score, which is why this tool gives you a band instead of a cutoff. Your healthy range depends on your age, sex and height. For reference, the middle fifth of US adults sat between 4.45 and 5.46, and that middle group had the lowest death rate in the 2024 NHANES analysis.
It can be. Adults in the lowest fifth, from 1.05 to under 3.41, were 25% more likely to die than the middle group. The relationship is U-shaped, not a straight line. Researchers generally read the low end as illness and muscle loss shrinking the waist rather than thinness itself causing harm.
Stand up, find the top of your hip bone, and run the tape around at that level so it sits snug and horizontal. Breathe out normally and read it then, not while holding your breath in. Measure against bare skin. An inch of error here moves your BRI calculator result by roughly a quarter of a point.
Better at one specific job. Because weight never enters the formula, roundness flags the person whose BMI reads normal but who carries fat around the middle. BMI misses that person entirely. Neither can separate muscle from fat, so run both and treat a disagreement between them as the useful signal.
Because the band is built from healthy body fat ranges, and those widen with age and differ between men and women. A 30-year-old man of 5 ft 10 in tops out around a 32.3 inch waist, while a 70-year-old man of the same height tops out near 37.8 inches. Same height, different band.
Not during pregnancy. Waist measurement stops meaning what the formula assumes it means, and no pregnancy reference ranges exist for it. If you carry a lot of muscle through the trunk, expect the score to overstate you, the same way BMI does. Body composition testing is the better route in both cases.
Every figure on this page is drawn from peer-reviewed research or national clinical guidance. Last verified September 2026.