
Body Fat Calculator
Last updated:

Muhammad Hamza is the founder of Health Calculator, dedicated to building accurate and easy-to-use health tools for everyone.

Dr. Farah Taqueer is a qualified Pediatrician based in Karachi. She reviews all health calculators on this site for clinical accuracy and medical correctness.
Enter your measurements above and you get four things: your body fat percentage, your category, your fat and lean mass in kilos, and your waist-to-height ratio. Your scale gives you none of that. Body fat percentage predicted 15-year mortality risk better than BMI in a 2025 study of 4,252 U.S. adults aged 20 to 49.
What Body Fat Percentage Is and Why It Matters
What Is Body Fat Percentage?
Body fat percentage is the share of your total weight made of fat tissue. At 80 kg and 17.3% body fat, roughly 13.8 kg of you is fat and 66.2 kg is lean mass, meaning muscle, bone, organs, and water.
Not all of it is bad. Essential fat keeps hormones, organs, and basic function running, sitting near 2% to 5% in men and 10% to 13% in women. Storage fat is everything above that.
How Body Fat Affects Your Health
Where you carry fat matters as much as how much. Visceral fat, packed around the organs, drives more risk than the subcutaneous kind under your skin.
- Higher central adiposity raises the risk of type 2 diabetes, hypertension and cardiovascular disease.
- BMI alone misses this. It cannot separate muscle from fat, so it flags lifters as overweight and clears people with normal-weight obesity.
- In January 2025 a Lancet Commission of 58 experts redefined clinical obesity to require a measure beyond BMI.
Pair your result with your BMI rather than choosing between them.
How to Calculate Body Fat Percentage
The Four Methods Explained
U.S. Navy method. Height, weight, neck, and waist, plus hips for women. Runs the Hodgdon and Beckett equations from 1984. Against DXA scans in 609 fit Marines, circumference methods underestimated men by 2.6 points and overestimated women by 2.3.
Worth knowing, because most calculators still say otherwise: the Navy retired this formula for its own test on 1 January 2026. The current assessment screens on waist-to-height at 0.5499, then applies table-based limits of 26% for men and 36% for women. The formula didn't break. Policy changed. For civilian tracking it still works well. Serving sailors should use the Navy Body Fat Calculator for a pass or fail against those current rules, and our Army Body Fat Calculator covers that branch's separate standard.
Relative Fat Mass (RFM). Newest and simplest here, needing only height and waist. Built on 12,581 NHANES adults and validated against DXA in 3,456 more. Among women it was accurate in 91.5% of cases against BMI's 21.6%. It also beat the Deurenberg and Kagawa equations in men.
Skinfold method. For caliper owners. Jackson-Pollock 3-site, chest, abdomen and thigh for men, tricep, suprailiac and thigh for women, converted through the Siri equation. Most precise here when technique is consistent. Least precise when it isn't. Past 120 mm total, the calculator warns you.
BMI method. Fastest, using Deurenberg 1991. It inherits BMI's blind spot on muscle. It was also built on Caucasian populations, and NICE notes that people of South Asian, Chinese, Middle Eastern, Black African or African-Caribbean background carry central adiposity at lower BMI. Treat it as a ballpark.
The Formulas, With a Worked Example
Men's Navy formula, computed in inches internally:
Body fat % = 86.010 × log₁₀(waist − neck) − 70.041 × log₁₀(height) + 36.76
RFM, which is refreshingly short:
RFM = 64 − 20 × (height ÷ waist) + 12 × sex (sex: 0 men, 1 women)
RFM is a ratio, so centimeters and inches both work if you stay consistent.
One man, all four methods. He is 178 cm, 80 kg, age 30, neck 38 cm, waist 86 cm. Skinfolds: chest 12 mm, abdomen 20 mm, thigh 15 mm.
| Method | Result | Category |
|---|---|---|
| U.S. Navy | 17.3% | Fitness |
| RFM | 22.6% | Acceptable |
| Skinfold, 47 mm total | 14.2% | Athletes |
| BMI method | 21.0% | Acceptable |
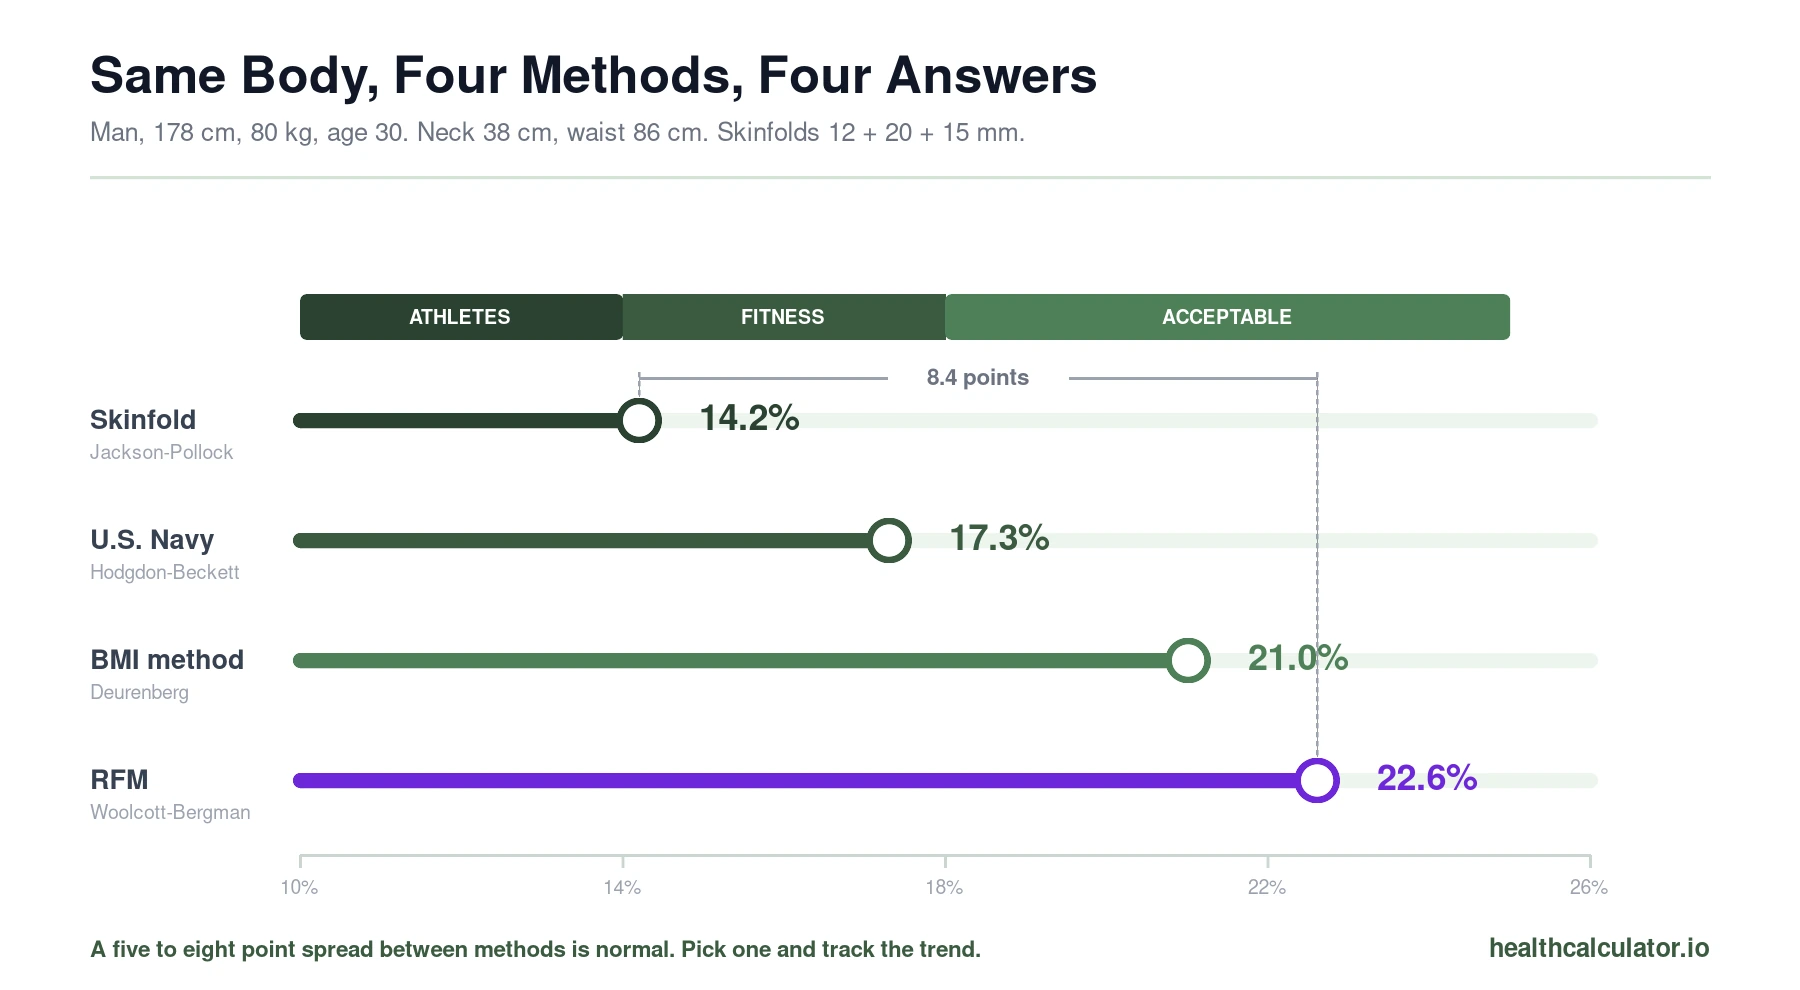
An 8.4 point spread. That's not a bug, and it's the most useful thing on this page. Each method infers fat from a different proxy. On the Navy method he also sees 13.8 kg fat mass, 66.2 kg lean mass, and a waist-to-height ratio of 0.4831.
Run those numbers above. You'll get the same figures, because it's the same code.
Body Fat Categories and What They Mean
| Category | Men | Women | What it signals |
|---|---|---|---|
| Below essential | Under 2% | Under 10% | Medically dangerous |
| Essential fat | 2% to 5% | 10% to 13% | The minimum your body needs |
| Athletes | 6% to 13% | 14% to 20% | Lean, competition level |
| Fitness | 14% to 17% | 21% to 24% | Fit, above average |
| Acceptable | 18% to 24% | 25% to 31% | Healthy, room to improve |
| Obese | 25% and above | 32% and above | Raised risk, see a doctor |
Land below the essential floor and the calculator flags it in red. Lower isn't better. Too little body fat disrupts hormones, bone health, and menstrual cycles.
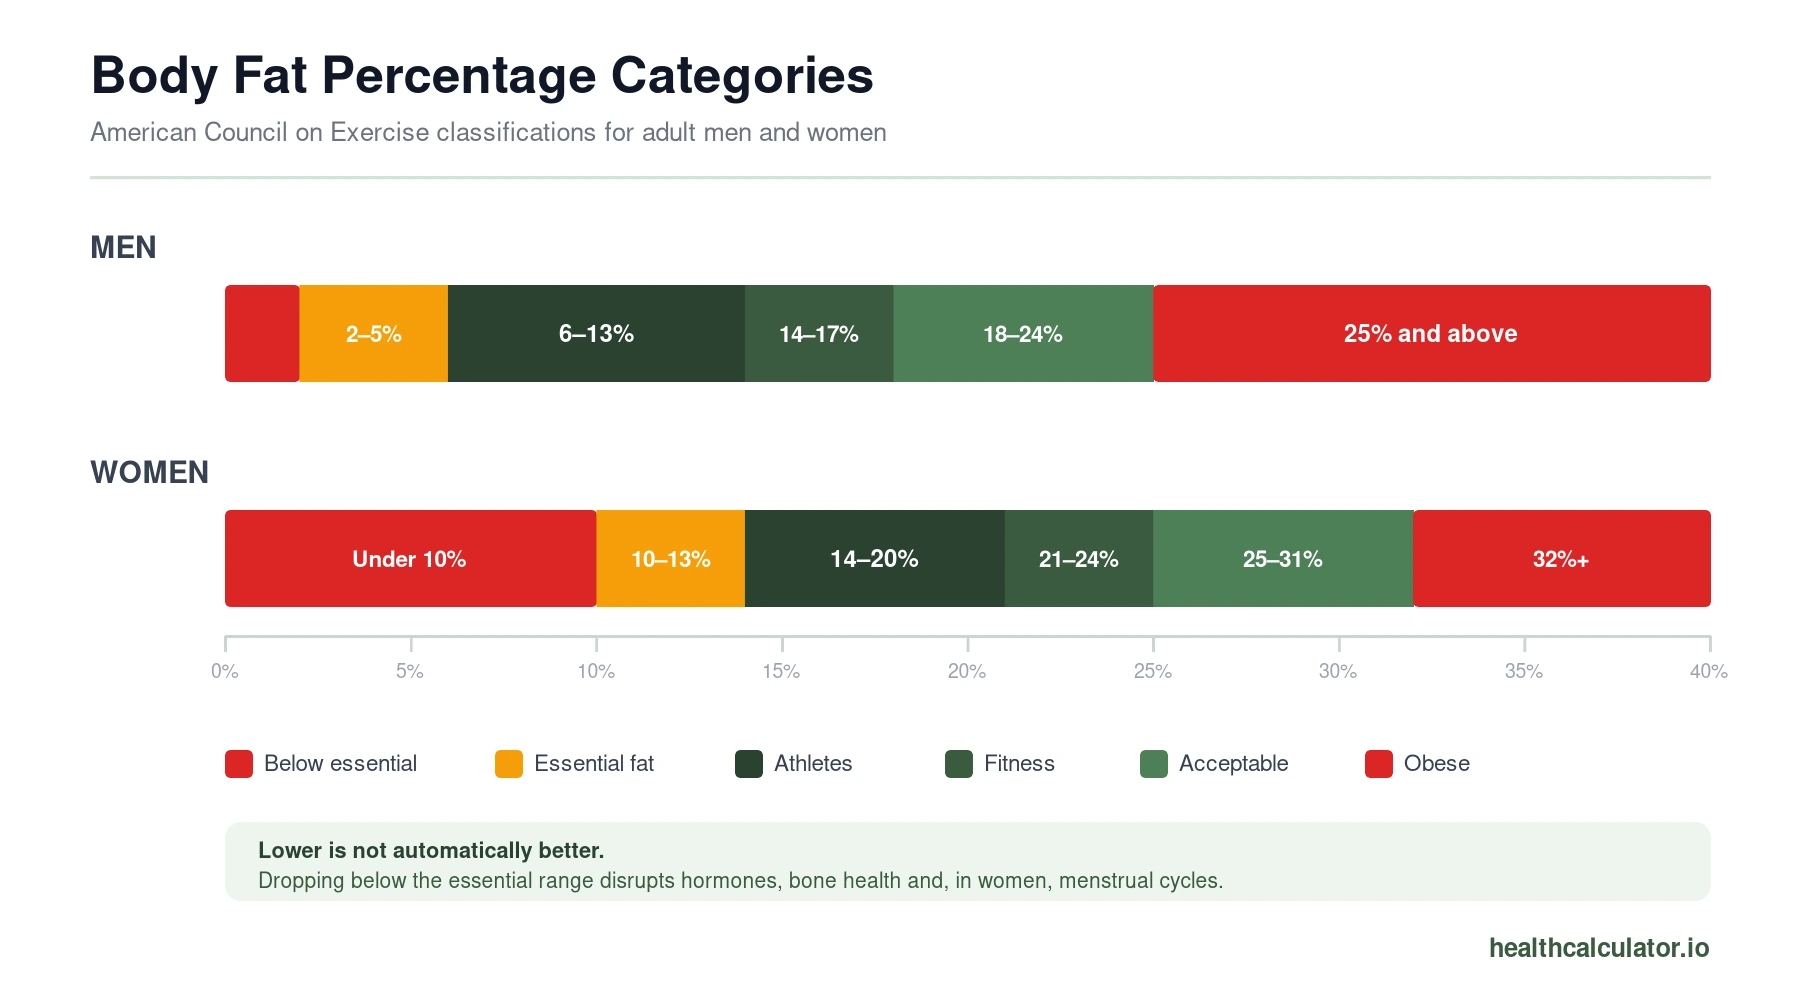
These are fitness-industry bands. Clinical researchers draw the line higher: an analysis of 16,918 U.S. adults working backward from metabolic syndrome put obesity nearer 30% in men and 42% in women. Neither set is wrong. ACE is stricter, better for training goals. The clinical figures track disease risk.
Your Waist-to-Height Ratio
Choose the Navy or RFM method and you also get this ratio, because both already collect the two numbers it needs. Body fat percentage says how much. This says where.
| Ratio | NICE classification |
|---|---|
| 0.40 to 0.49 | Healthy central adiposity, no increased risk |
| 0.50 to 0.59 | Increased central adiposity |
| 0.60 and above | High central adiposity |
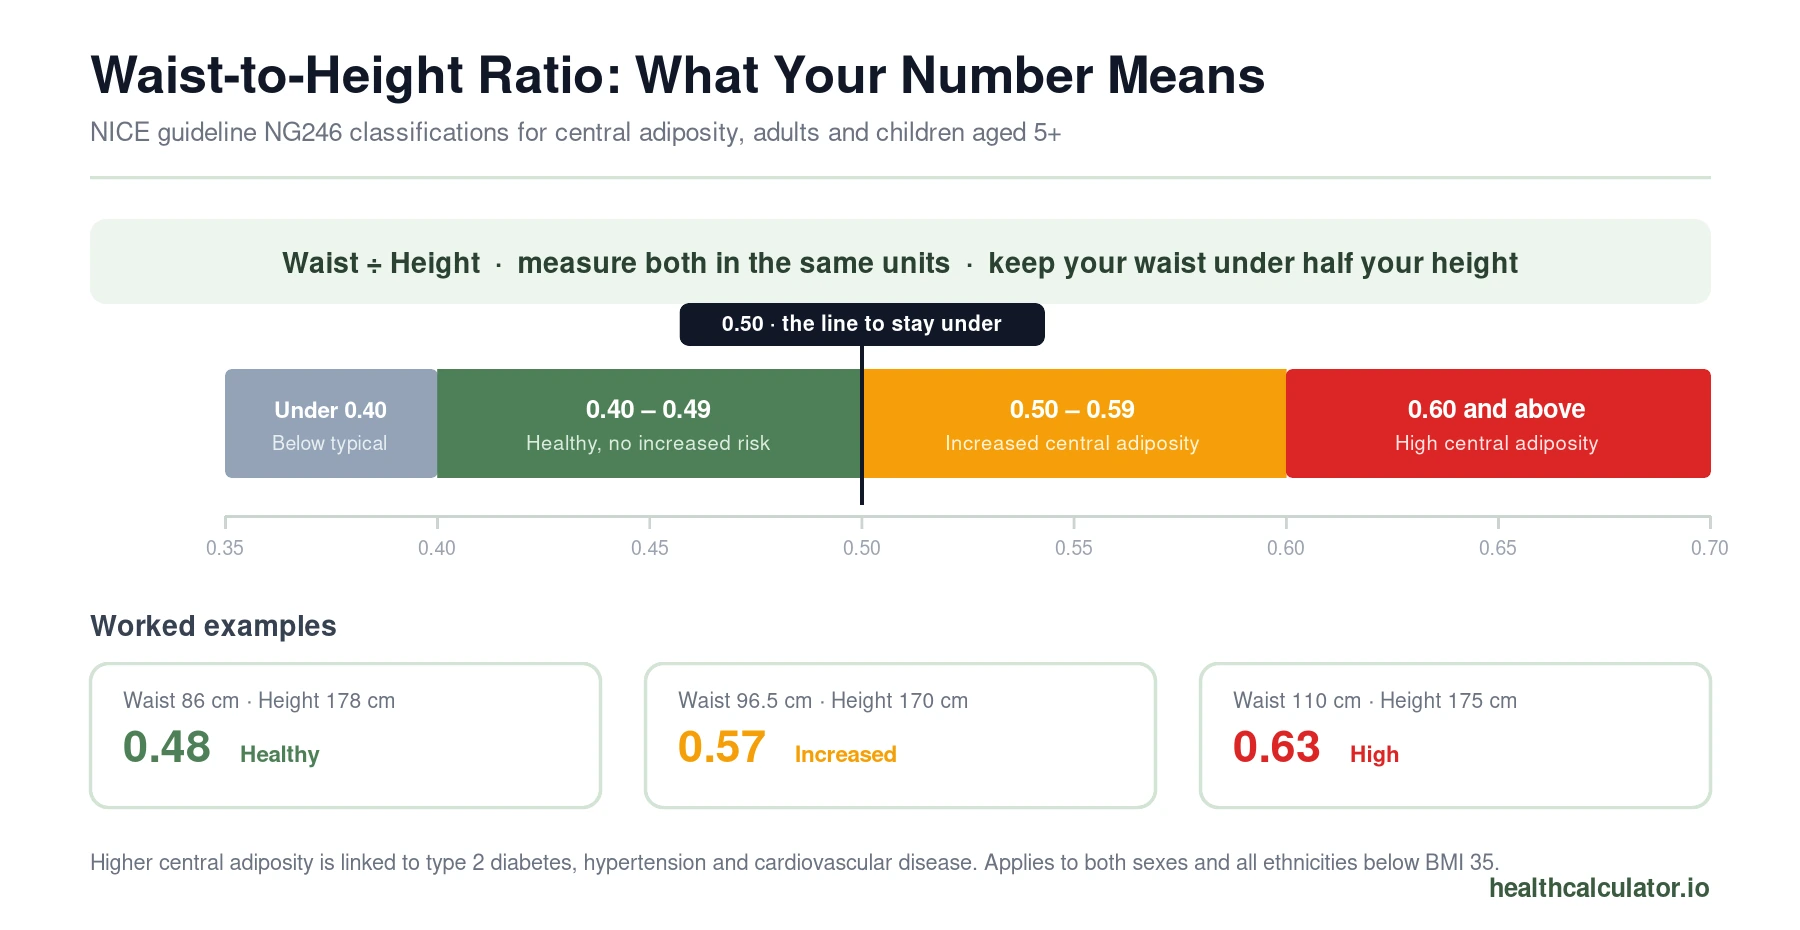
The plain-English version NICE recommends telling patients: keep your waist under half your height. These bands apply to both sexes and all ethnicities at a BMI under 35 kg/m². Our worked example sits at 0.4831. Comfortably healthy.
That 0.5 line isn't arbitrary. A systematic review of 78 studies across fourteen countries, covering Caucasian, Asian and Central American populations, found the mean boundary value for cardiometabolic risk landed at 0.50 in both sexes. The same review found waist-to-height outperformed BMI at predicting diabetes and cardiovascular disease.
Limitations of Body Fat Estimates
Every method here approximates, and the calculator says so on purpose.
- Navy method: assumes typical fat distribution. The Marine data showed lean people overestimated and higher-fat people underestimated.
- RFM: keys entirely off your waist, so it can miss fat carried on hips and thighs.
- Skinfold: swings with pinch technique, and those equations came from largely white samples.
- BMI method: cannot see muscle at all.
DXA and clinical bioelectrical impedance remain the reference standards. Note that NICE advises against bioimpedance as a substitute for BMI in general adiposity screening.
Here's the practical rule: the number matters less than the direction. Pick one method, measure the same way each time, and watch the trend across weeks. A method that's consistently off by two points still shows your progress. Method-hopping just adds noise.
Why Use Our Body Fat Calculator
Four methods in one place, including RFM, which almost no free tool offers. Instant results, a fat-versus-lean breakdown, an age-adjusted target, and your waist-to-height ratio alongside the percentage. Free, mobile-friendly, no sign-up, nothing stored.
Once you have your number, use the protein calculator to protect lean mass while cutting fat, and check your daily water intake to keep measurements consistent.
Men vs Women: Why the Ranges Differ
Women carry more essential fat, roughly 10% to 13% against 2% to 5% in men, supporting hormonal and reproductive function. Every category sits several points higher as a result. The waist-to-height bands are the exception. NICE applies the same 0.5 threshold to both sexes.
This Calculator Should Not Replace Medical Advice
This calculator is for informational and screening purposes only and does not constitute medical advice or diagnosis. Body fat estimates are approximate and vary by method. Always consult a qualified healthcare professional.
Frequently Asked Questions
Circumference methods tested against DXA in 609 fit Marines underestimated men by 2.6 points and overestimated women by 2.3. Accuracy drops at both extremes: very lean people read high, higher-fat people read low. It remains reliable for tracking change over time.
No. Since 1 January 2026 the Navy's assessment has been two steps and does not measure the neck. Step one divides waist by height with a 0.5499 cutoff. Step two uses official tables limited to 26% for men and 36% for women. Run the current two-step assessment if you need an official result.
Relative Fat Mass is a 2018 formula needing only height and waist. Validated against DXA in 3,456 U.S. adults, it was accurate in 91.5% of women versus BMI's 21.6%. Not strictly better than the Navy method, but newer and simpler. Running both gives you a useful range.
Each infers fat from a different proxy: tape circumferences, a height-to-waist ratio, skinfold thickness, or BMI. A five to eight point spread is normal. Our worked example spans 8.4 points across the four. Pick the method matching your equipment, then stay with it.
Roughly 14% to 24% for men and 21% to 31% for women covers the fitness and acceptable bands. Athletes sit lower, 6% to 13% for men and 14% to 20% for women. Some fat is essential, so going too low carries its own risks.
Under 0.50. NICE classifies 0.40 to 0.49 as healthy, 0.50 to 0.59 as increased central adiposity, and 0.60 or above as high. A review of 78 studies across fourteen countries put the risk boundary at 0.50 in both sexes.
No. DXA is the criterion method researchers measure everything else against, including every formula on this page. This calculator gives a solid free estimate you can repeat at home and track over months. For a clinical-grade single reading, book a scan.
Sources
Every figure on this page is drawn from government health statistics or peer-reviewed research. Last verified August 2026.
- Sui X, Wang Y, Chen J, et al. Body Mass Index vs Body Fat Percentage as a Predictor of Mortality in Adults Aged 20-49 Years. Annals of Family Medicine. 2025. doi:10.1370/afm.240330.
- American Council on Exercise. Percent Body Fat Calculator: Body Fat Categories. ACE Fitness.
- National Institute for Health and Care Excellence. Identifying and assessing overweight, obesity and central adiposity. NICE guideline NG246; published 14 January 2025, last updated 8 January 2026.
- Browning LM, Hsieh SD, Ashwell M. A systematic review of waist-to-height ratio as a screening tool for the prediction of cardiovascular disease and diabetes: 0.5 could be a suitable global boundary value. Nutrition Research Reviews. 2010;23(2):247-269. PMID:20819243.
- Rubino F, Cummings DE, Eckel RH, et al. Definition and diagnostic criteria of clinical obesity. The Lancet Diabetes & Endocrinology. 2025;13(3):221-262.
- Potter AW, Nindl LJ, Soto LD, et al. Circumference-Based Predictions of Body Fat Revisited: Preliminary Results From a US Marine Corps Body Composition Survey. Frontiers in Physiology. 2022;13:868627. doi:10.3389/fphys.2022.868627.
- U.S. Navy. Guide-4: Body Composition Assessment. MyNavy HR, Physical Readiness Program; June 2026.
- Woolcott OO, Bergman RN. Relative fat mass (RFM) as a new estimator of whole-body fat percentage: a cross-sectional study in American adult individuals. Scientific Reports. 2018;8:10980. doi:10.1038/s41598-018-29362-1.
- Jackson AS, Pollock ML. Generalized equations for predicting body density of men. British Journal of Nutrition. 1978;40(3):497-504.
- Pasco JA, Holloway KL, Dobbins AG, et al. Defining Overweight and Obesity by Percent Body Fat Instead of Body Mass Index. The Journal of Clinical Endocrinology & Metabolism. 2025;110(4):e1103-e1111.