

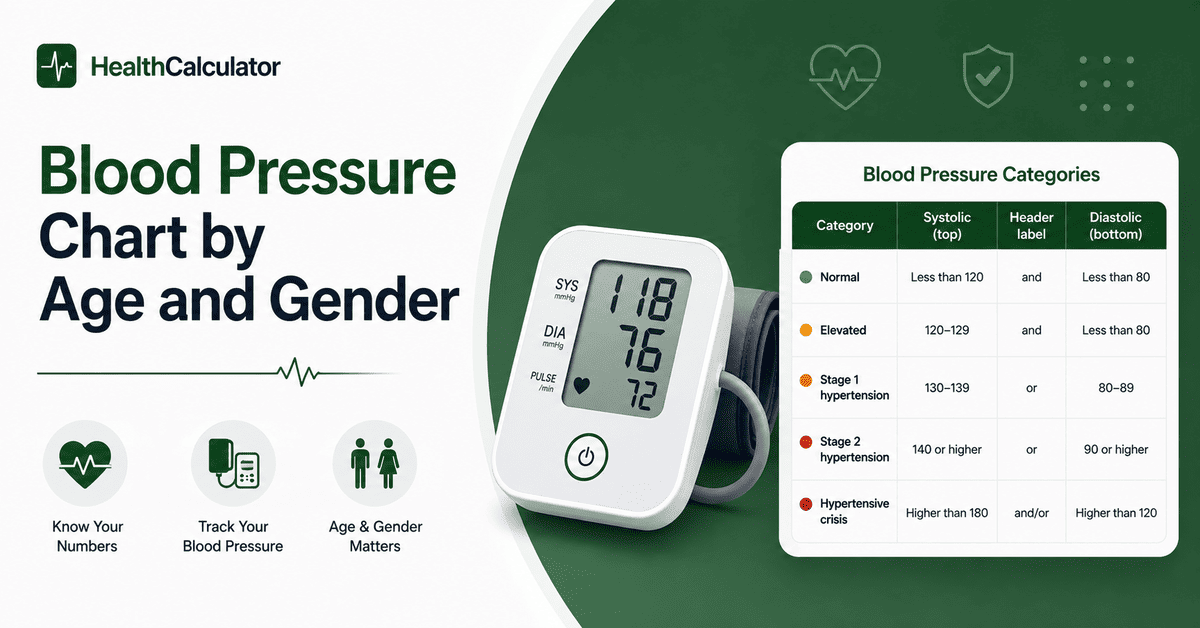
Here’s what almost every blood pressure chart by age and gender gets wrong: the healthy target never changes. For every adult — 25 or 75, man or woman — normal is less than 120/80 mmHg. What changes with age and sex isn’t the goal. It’s how likely you are to miss it.
That distinction matters more than any chart. Let’s go through both.
The Real Blood Pressure Chart by Age and Gender: One Set of Categories
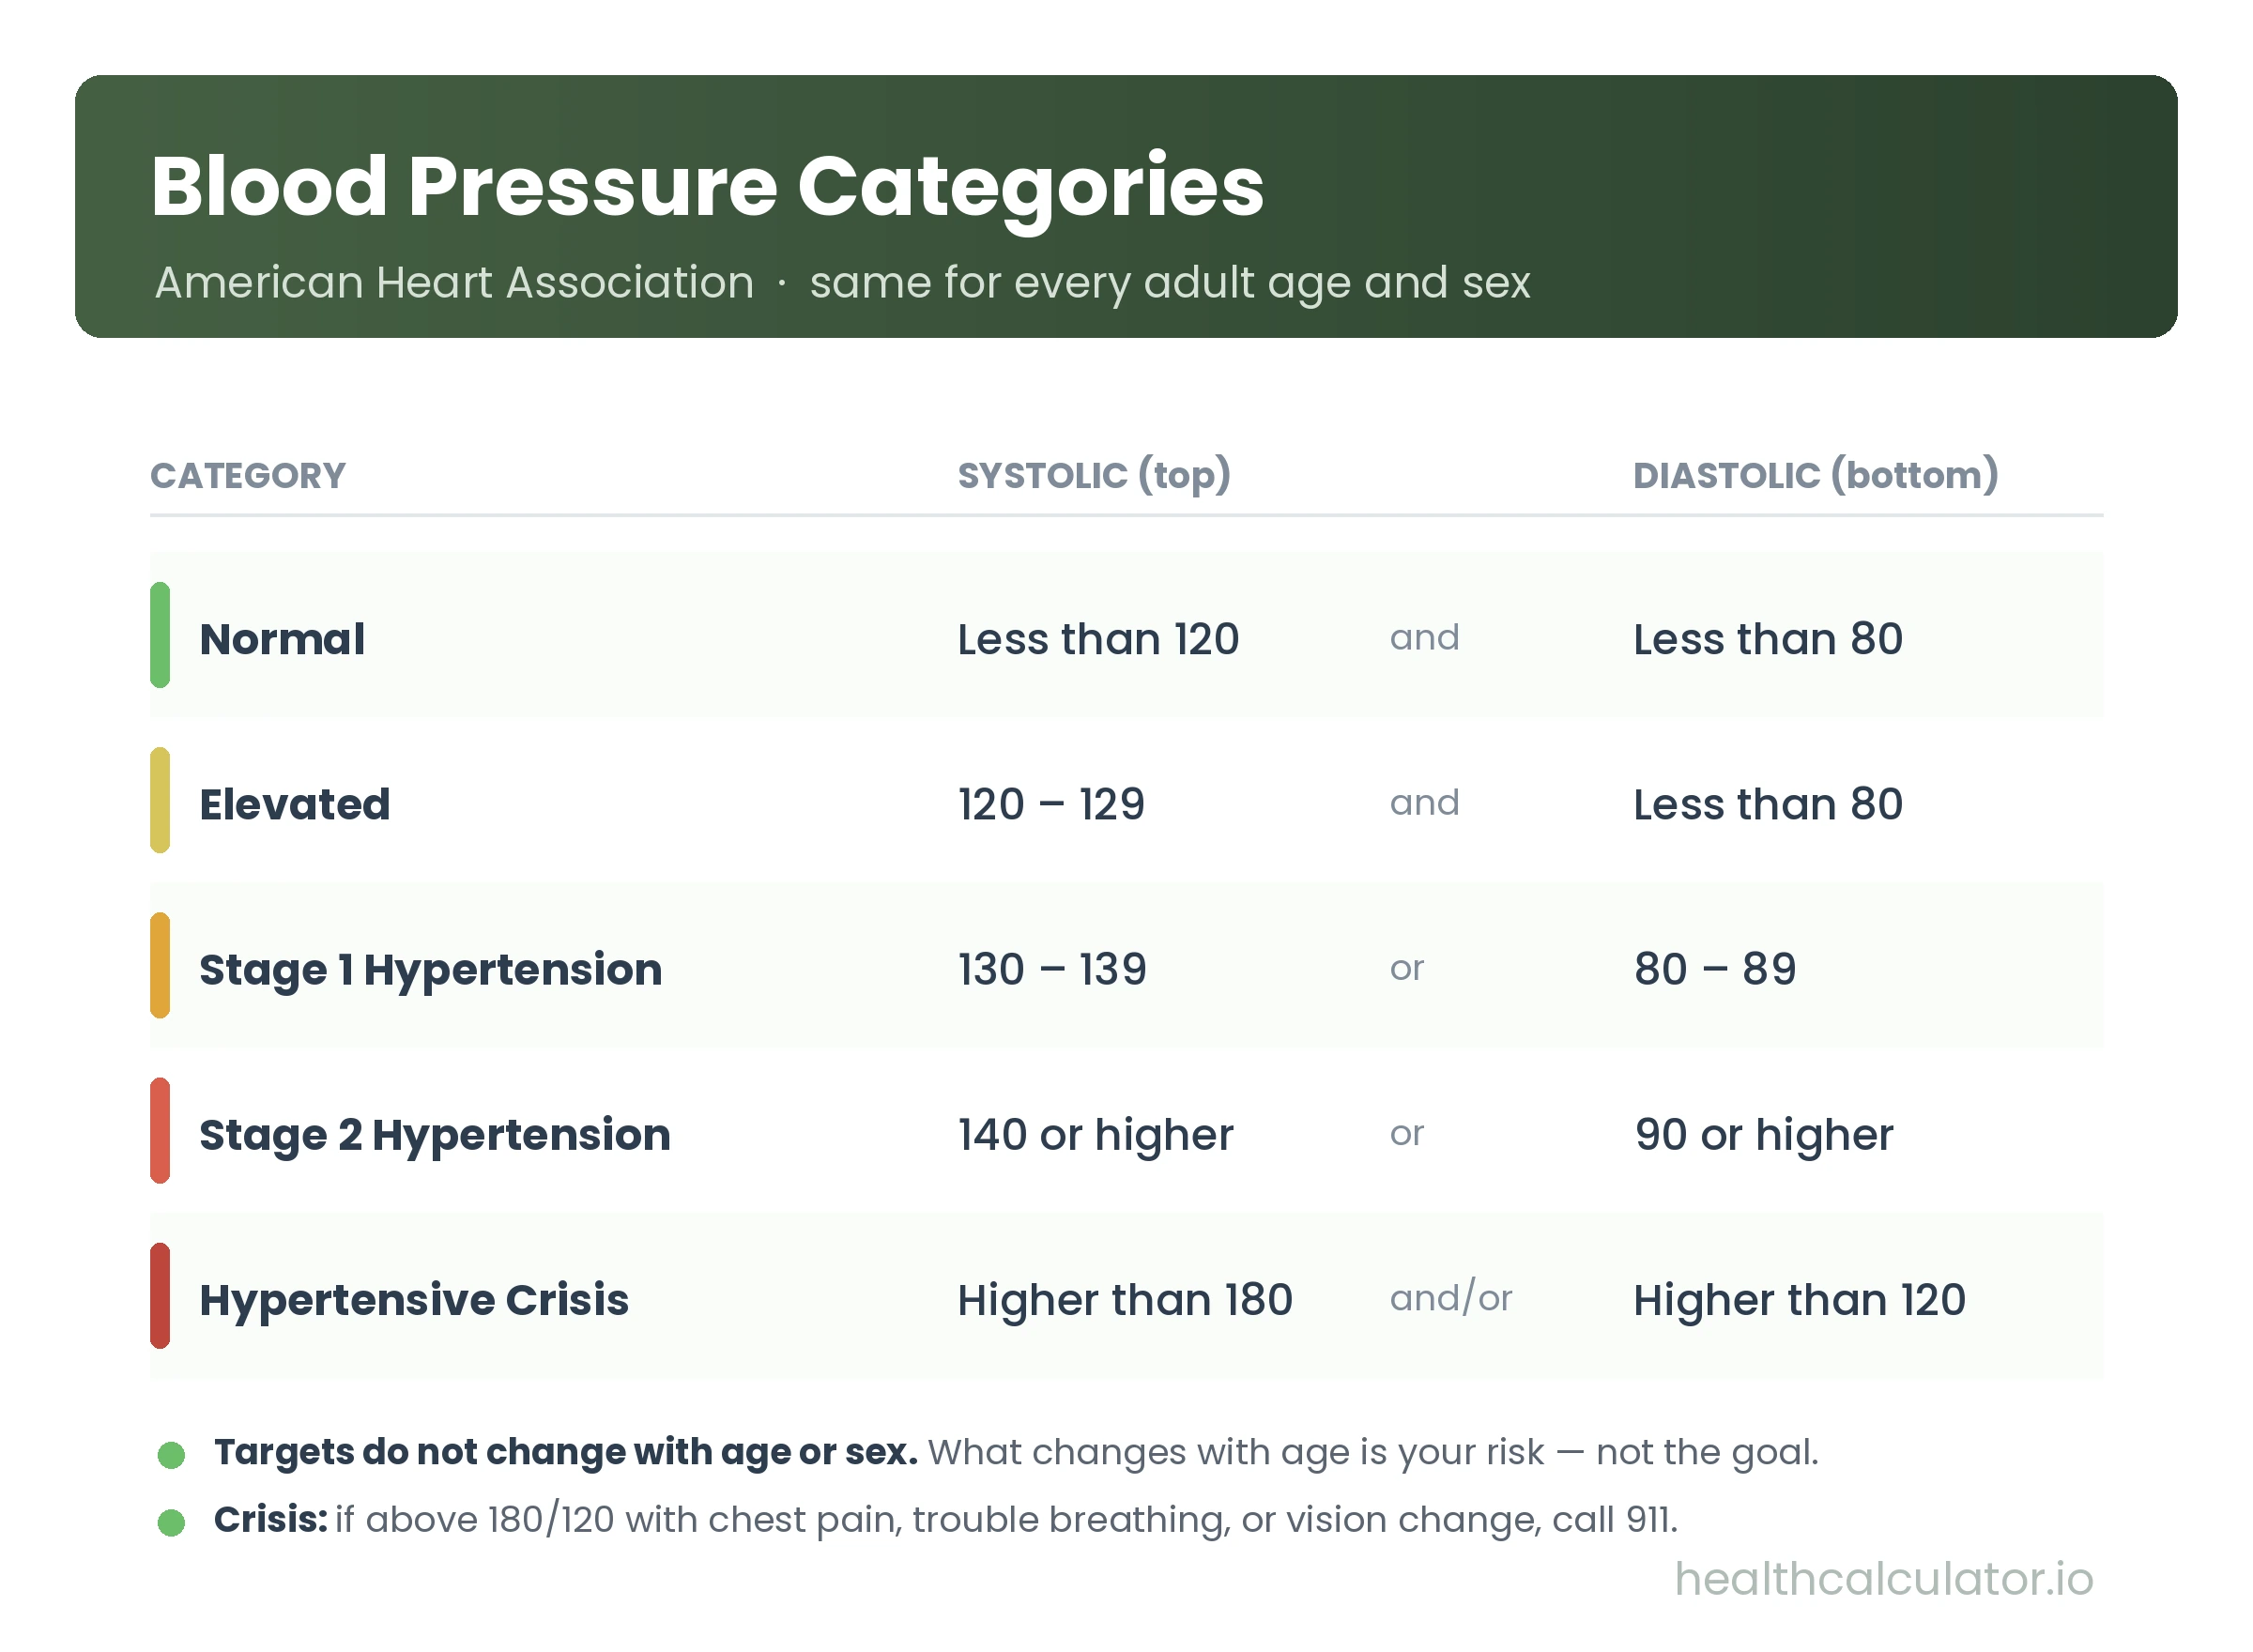
The American Heart Association sorts every adult reading into five categories. No age column. No gender column.
| Category | Systolic (top) | Diastolic (bottom) | |
|---|---|---|---|
| Normal | Less than 120 | and | Less than 80 |
| Elevated | 120–129 | and | Less than 80 |
| Stage 1 hypertension | 130–139 | or | 80–89 |
| Stage 2 hypertension | 140 or higher | or | 90 or higher |
| Hypertensive crisis | Higher than 180 | and/or | Higher than 120 |
Source: AHA blood pressure categories. Note the “and” versus “or” — for Stage 1 and 2, either number crossing the line puts you in that category.
The CDC states it just as plainly: high blood pressure is consistently at or above 130/80 mmHg, and “no matter your age,” you can take steps to stay in a healthy range.
So if you came here looking for a chart showing that 140/90 is fine once you turn 65 — that chart doesn’t exist in current guidelines. What does exist is far more useful.
What Actually Changes With Age: Your Odds
The target holds steady. Your risk of missing it climbs steeply.
Across U.S. adults, 47.7% have hypertension — but that number hides an enormous age spread:
| Age group | Share with high blood pressure |
|---|---|
| 18–39 | 23.4% |
| 40–59 | 52.5% |
| 60 and older | 71.6% |
By 60, roughly seven in ten adults have hypertension. That’s not a reason to relax the target. It’s the reason the target matters.
There’s a physiological driver behind this. The AHA notes that systolic pressure usually goes up with age because large arteries stiffen and plaque builds up over time — which is also why systolic tells you more about heart disease risk once you’re past 50.
Blood Pressure by Gender: The Gap That Closes
Now the part almost no chart shows you.
Men lead women in hypertension overall — 50.8% versus 44.6%. Break it down by age and the story gets interesting:
| Age group | Men | Women |
|---|---|---|
| 18–39 | 30.0% | 16.4% |
| 40–59 | 55.9% | 49.0% |
| 60+ | No significant difference | No significant difference |
Young men are nearly twice as likely as young women to have high blood pressure. By midlife that lead shrinks to under 7 points. And past 60? The CDC found the difference between men and women was not statistically significantat all.
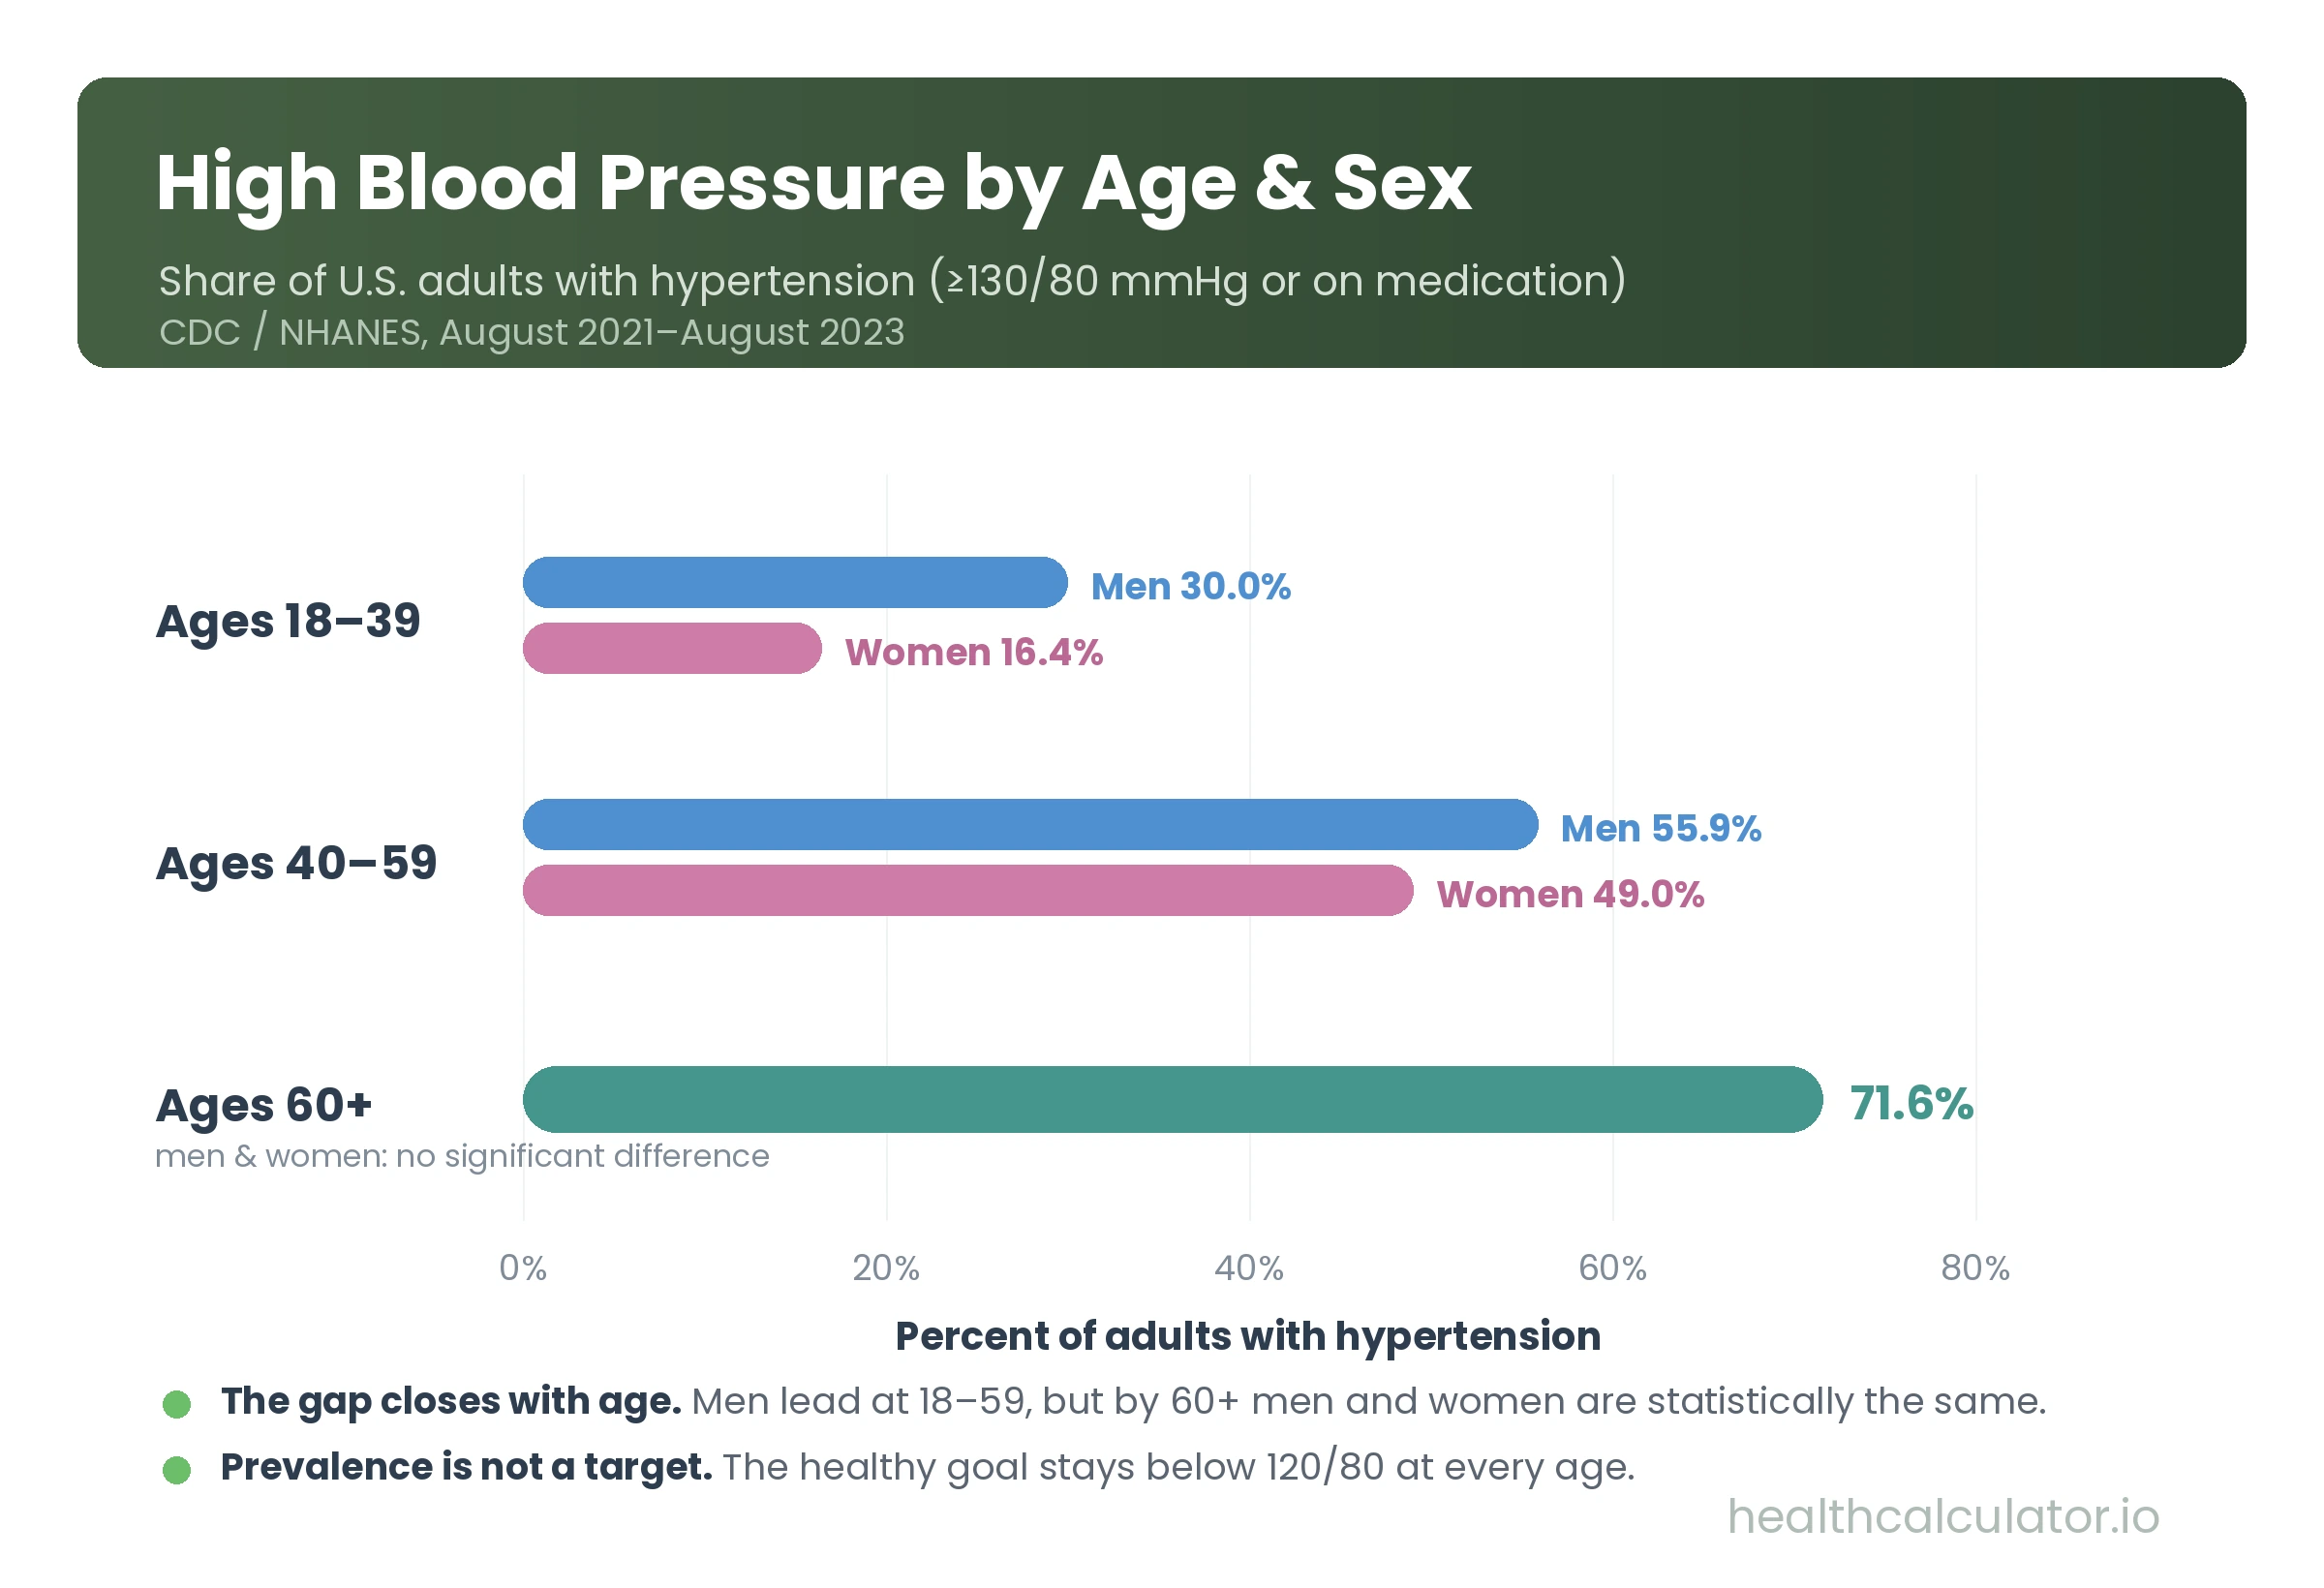
Women catch up. And research suggests they don’t just catch up — they climb faster the whole way.
A study tracking 32,833 people across four decades, ages 5 to 98, found that women showed a steeper increase in blood pressure than men — starting as early as their twenties and continuing for life. The difference held even after adjusting for other cardiovascular risk factors.
The authors’ conclusion pushes back on decades of assumption. Rather than women’s vascular disease lagging men’s by 10 to 20 years, they wrote, blood pressure measures “actually progress more rapidly in women than in men, beginning early in life.”
Practical takeaway for women: a normal reading in your twenties doesn’t buy you the safety margin people assume. Track the trend.
Why “Average Blood Pressure by Age” Charts Mislead You
Search this topic and you’ll find charts listing an average reading for each decade of life, climbing steadily from your twenties into your seventies.
Those averages come from real survey data. They’re also easy to misread in a dangerous way.
An average tells you what people have. A target tells you what’s healthy. Since roughly half of U.S. adults have hypertension, the average adult reading includes millions of people with an untreated medical condition. Matching the average for your age group doesn’t mean you’re fine — it can mean you’re typically unwell.
Here’s the honest framing: use age-and-sex data to understand your risk, and use the AHA categories to judge your reading. Never swap them.
Case Study: Two Readings, Same Number, Different Story
A 34-year-old man reads 138/86.
Look it up on the category chart: systolic 130–139, diastolic 80–89. That’s Stage 1 hypertension. Now the age context — only 30.0% of men his age have hypertension, so he’s in the minority, and he has decades of arterial stress ahead if nothing changes. Early action matters most here.
A 68-year-old woman reads 138/86.
Identical numbers. Identical category: Stage 1 hypertension. The difference is context, not classification — she’s among the 71.6% of over-60s with high blood pressure, which makes it common but no less worth treating.
Same reading, same diagnosis, same target. What differs is the conversation each has with their doctor about risk and treatment.
Want the single-number version of these readings? Run them through our MAP calculator to see mean arterial pressure, which tells you how well blood is reaching your organs.
Blood Pressure in Children: The Real Age Exception
There is exactly one place where age genuinely changes the numbers — and it’s younger than most people expect.
For children aged 1 to 12, normal blood pressure is defined by percentile — comparing a child against others of the same age, sex, and height — not against a fixed threshold. Under the 90th percentile is normal; at or above the 95th percentile is Stage 1 hypertension. The same reading can be normal for a tall 12-year-old and high for a small 6-year-old.
From age 13 onward, that changes. Adolescents are measured against the same fixed adult numbers as everyone else: normal under 120/80, Stage 1 at 130–139/80–89, Stage 2 at 140/90 or above.
So the adult table above applies from 13 up. Below that, use pediatric percentile charts, and check any child’s reading with their pediatrician.
How to Read Your Own Numbers Properly
A single reading is not a diagnosis. Get the measurement right first.
Sit quietly for five minutes with your back supported and feet flat. Skip caffeine, nicotine, and exercise for 30 minutes beforehand. Use a properly fitted cuff at heart level. Take two readings a minute apart and average them. Measure at the same time of day when comparing.
Then check the category — not the age average. If you’re consistently at or above 130/80, that’s worth a doctor’s visit regardless of your age.
One number worth knowing: among adults with hypertension, only 20.7% have it controlled below 130/80. Awareness is a big part of the gap — only 59.2% even know they have it. Measuring is how you leave that statistic.
What to Do If Your Reading Is Above Normal
Recheck properly across several days before drawing conclusions. Patterns matter more than outliers.
If the pattern holds at or above 130/80, book a doctor’s visit. If a reading tops 180/120 with chest pain, shortness of breath, vision change, or difficulty speaking — that’s a hypertensive crisis, and it’s a 911 call, not a wait-and-see.
Then look at what drives the number. Extra weight is a major contributor, and you can check yours with our BMI calculator. Because kidneys and blood pressure are tightly linked, our GFR calculator estimates your filtration rate. If blood sugar is a concern, the A1C calculator tracks your three-month average. And for a deeper read on what your systolic and diastolic combine into, see our guide on the mean arterial pressure normal range.
This article is for informational and screening purposes only and does not constitute medical advice, diagnosis, or treatment. A blood pressure reading outside the normal range is not a diagnosis, and a reading within it does not rule out a condition. Always consult a qualified healthcare professional to interpret your results in the context of your full clinical picture.
Frequently Asked Questions
Normal is less than 120/80 mmHg for every adult, regardless of age or gender. Guidelines set one universal target. What changes with age and sex is your likelihood of having high blood pressure — from 23.4% of adults aged 18–39 to 71.6% of those 60 and older.
No. Under current guidelines, 140/90 is Stage 2 hypertension at any adult age, including 70. It’s common in older adults — over 70% of people past 60 have hypertension — but common isn’t the same as normal. A consistent reading at that level warrants medical evaluation.
No. Targets are identical. Prevalence differs: men lead women 50.8% to 44.6% overall, and nearly 2-to-1 among adults aged 18–39. But by age 60 and over, the CDC found no statistically significant difference between the sexes.
Average readings do rise, mainly because arteries stiffen and plaque accumulates, which pushes systolic pressure up. But “natural” doesn’t mean harmless — the healthy target stays below 120/80 at every age, and rising pressure raises cardiovascular risk regardless of how typical it is.
Women’s. A study of 32,833 people over four decades found women showed a steeper rise in blood pressure than men, beginning as early as their twenties and persisting across the life course even after adjusting for other risk factors.
A reading higher than 180/120 mmHg is a hypertensive crisis. Wait one minute and retest. If it’s still that high and you have chest pain, shortness of breath, back pain, numbness, weakness, vision change, or difficulty speaking, call 911. Without symptoms, contact your doctor promptly.
For ages 1 to 12, normal is defined by percentile for the child’s age, sex, and height — under the 90th percentile is normal, and 95th or above is Stage 1 hypertension. From age 13 onward, adolescents use the same fixed adult thresholds (normal under 120/80). Always check a child’s reading with their pediatrician.
If your readings are normal, a check at each routine medical visit is generally enough. If you’re in the elevated or hypertensive range, or being treated, your doctor will usually want home monitoring. Given that only 20.7% have it controlled, regular measurement is one of the highest-value habits available.
Sources
Every figure on this page is drawn from clinical guidelines, government health statistics, or peer-reviewed research. Last verified July 2026.
- American Heart Association. Understanding Blood Pressure Readings. AHA; last reviewed 14 August 2025.
- Centers for Disease Control and Prevention. About High Blood Pressure. CDC; reviewed 28 January 2026.
- Fryar CD, Kit B, Carroll MD, Afful J. Hypertension prevalence, awareness, treatment, and control among adults age 18 and older: United States, August 2021–August 2023. NCHS Data Brief. 2024;(511). doi:10.15620/cdc/164016.
- Ji H, Kim A, Ebinger JE, Niiranen TJ, Claggett BL, Bairey Merz CN, Cheng S. Sex Differences in Blood Pressure Trajectories Over the Life Course. JAMA Cardiology. 2020;5(3):19–26. doi:10.1001/jamacardio.2019.5306.
- New guidelines for hypertension in children and adolescents. PMCID: PMC8031116.
- National Center for Health Statistics. High Blood Pressure Facts. Centers for Disease Control and Prevention; reviewed 2 June 2026.