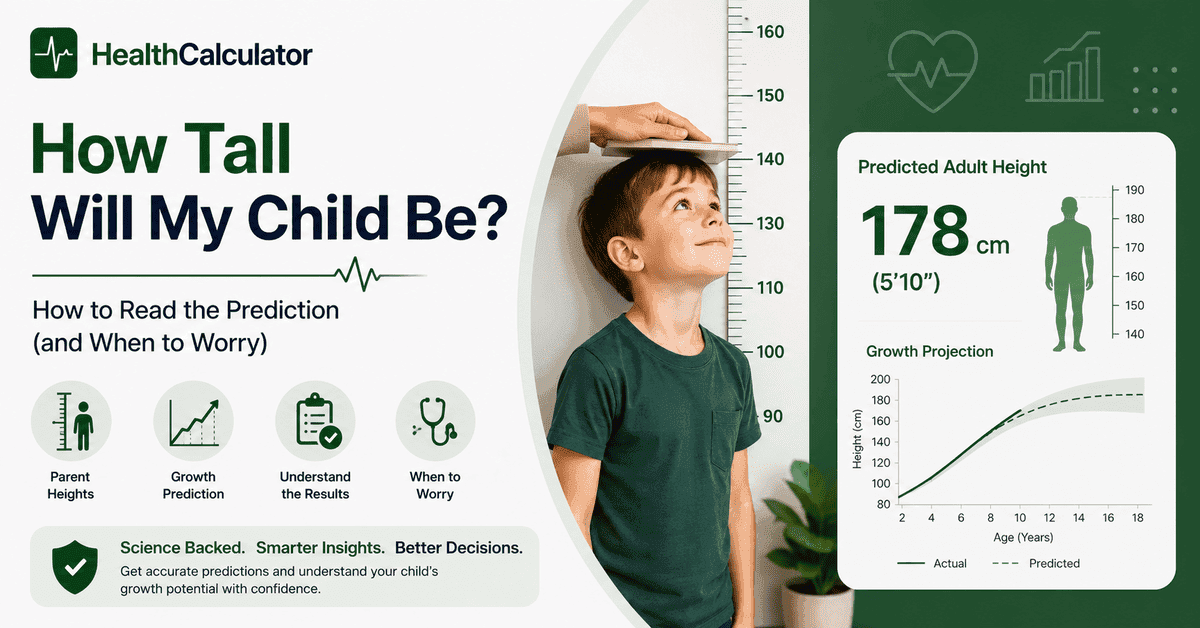
How tall will my child be? Add both parents’ heights together, then add 13 cm for a son or subtract 13 cm for a daughter, and divide by two. That is your child’s mid-parental target height. Most children finish within about 8.5 cm of it — a spread of roughly 17 cm, which is why the number is a reference point rather than a prediction.
Enter both parents’ heights — works even before a baby is born.
Now the part that number can’t tell you.
It is built entirely from you and your partner. It knows nothing about the child standing in front of you — not their height, not their growth so far, not whether they are thriving or struggling. Which is why a low prediction is rarely the thing worth worrying about, and a falling one almost always is.
The Number Takes Ten Seconds. Reading It Takes Longer.
Every height calculator on the internet hands you a figure and stops. Here’s what your pediatrician does with that same figure, and why they reach a different conclusion than a worried parent reading it alone.
Three things decide whether a prediction means anything: whether the inputs were measured or guessed, whether you compared it against your child’s actual growth curve, and how old your child is. Get those wrong and the number is noise. Get them right and it becomes genuinely useful — not as a forecast, but as a reference line.
We’ll take them in order. If you want the mechanics of the formulas themselves, our child height predictor walks through both methods and runs them for you.
Step One: Measure the Parents. Don’t Ask Them.
This is the step everyone skips, and it quietly wrecks more predictions than any flaw in the formula.
Researchers at a pediatric endocrinology clinic questioned parents about their height, then measured them on a stadiometer — without warning them first. Across 241 families, only 50% of fathers reported their height within 2 cm of the truth. Mothers managed 58%. Fathers overestimated themselves by an average of 1.7 cm.
Asking one parent about the other is worse. When mothers reported their partner’s height, the average came out at 177 cm — against a measured paternal average of 173.2 cm. Nearly 4 cm of pure invention.
The knock-on effect lands squarely on the prediction. Only 70% of target heights calculated from reported figures fell within 2 cm of the same calculation using measured figures. Individual errors ran from −7.9 cm to +9.8 cm.
So: shoes off, heels and shoulders against a wall, eyes level, measure at the crown. Both parents. It takes two minutes and it is the single highest-value thing you can do before touching a calculator.
There’s a second, subtler reason to measure rather than remember. Adults begin losing height from around age 30, and the loss isn’t linear. The height a 55-year-old father remembers from his twenties is not the height that belongs in this formula — but neither is a stale memory of it.
Target Height vs Projected Height: the Comparison That Matters
Here are the two numbers your pediatrician actually puts side by side.
Target height is what genetics predicts — the mid-parental figure, calculated from the parents alone.
Projected height is where your child is actually heading. You find it by plotting their current height on a CDC growth chart, finding their percentile, and following that percentile line out to age 20.
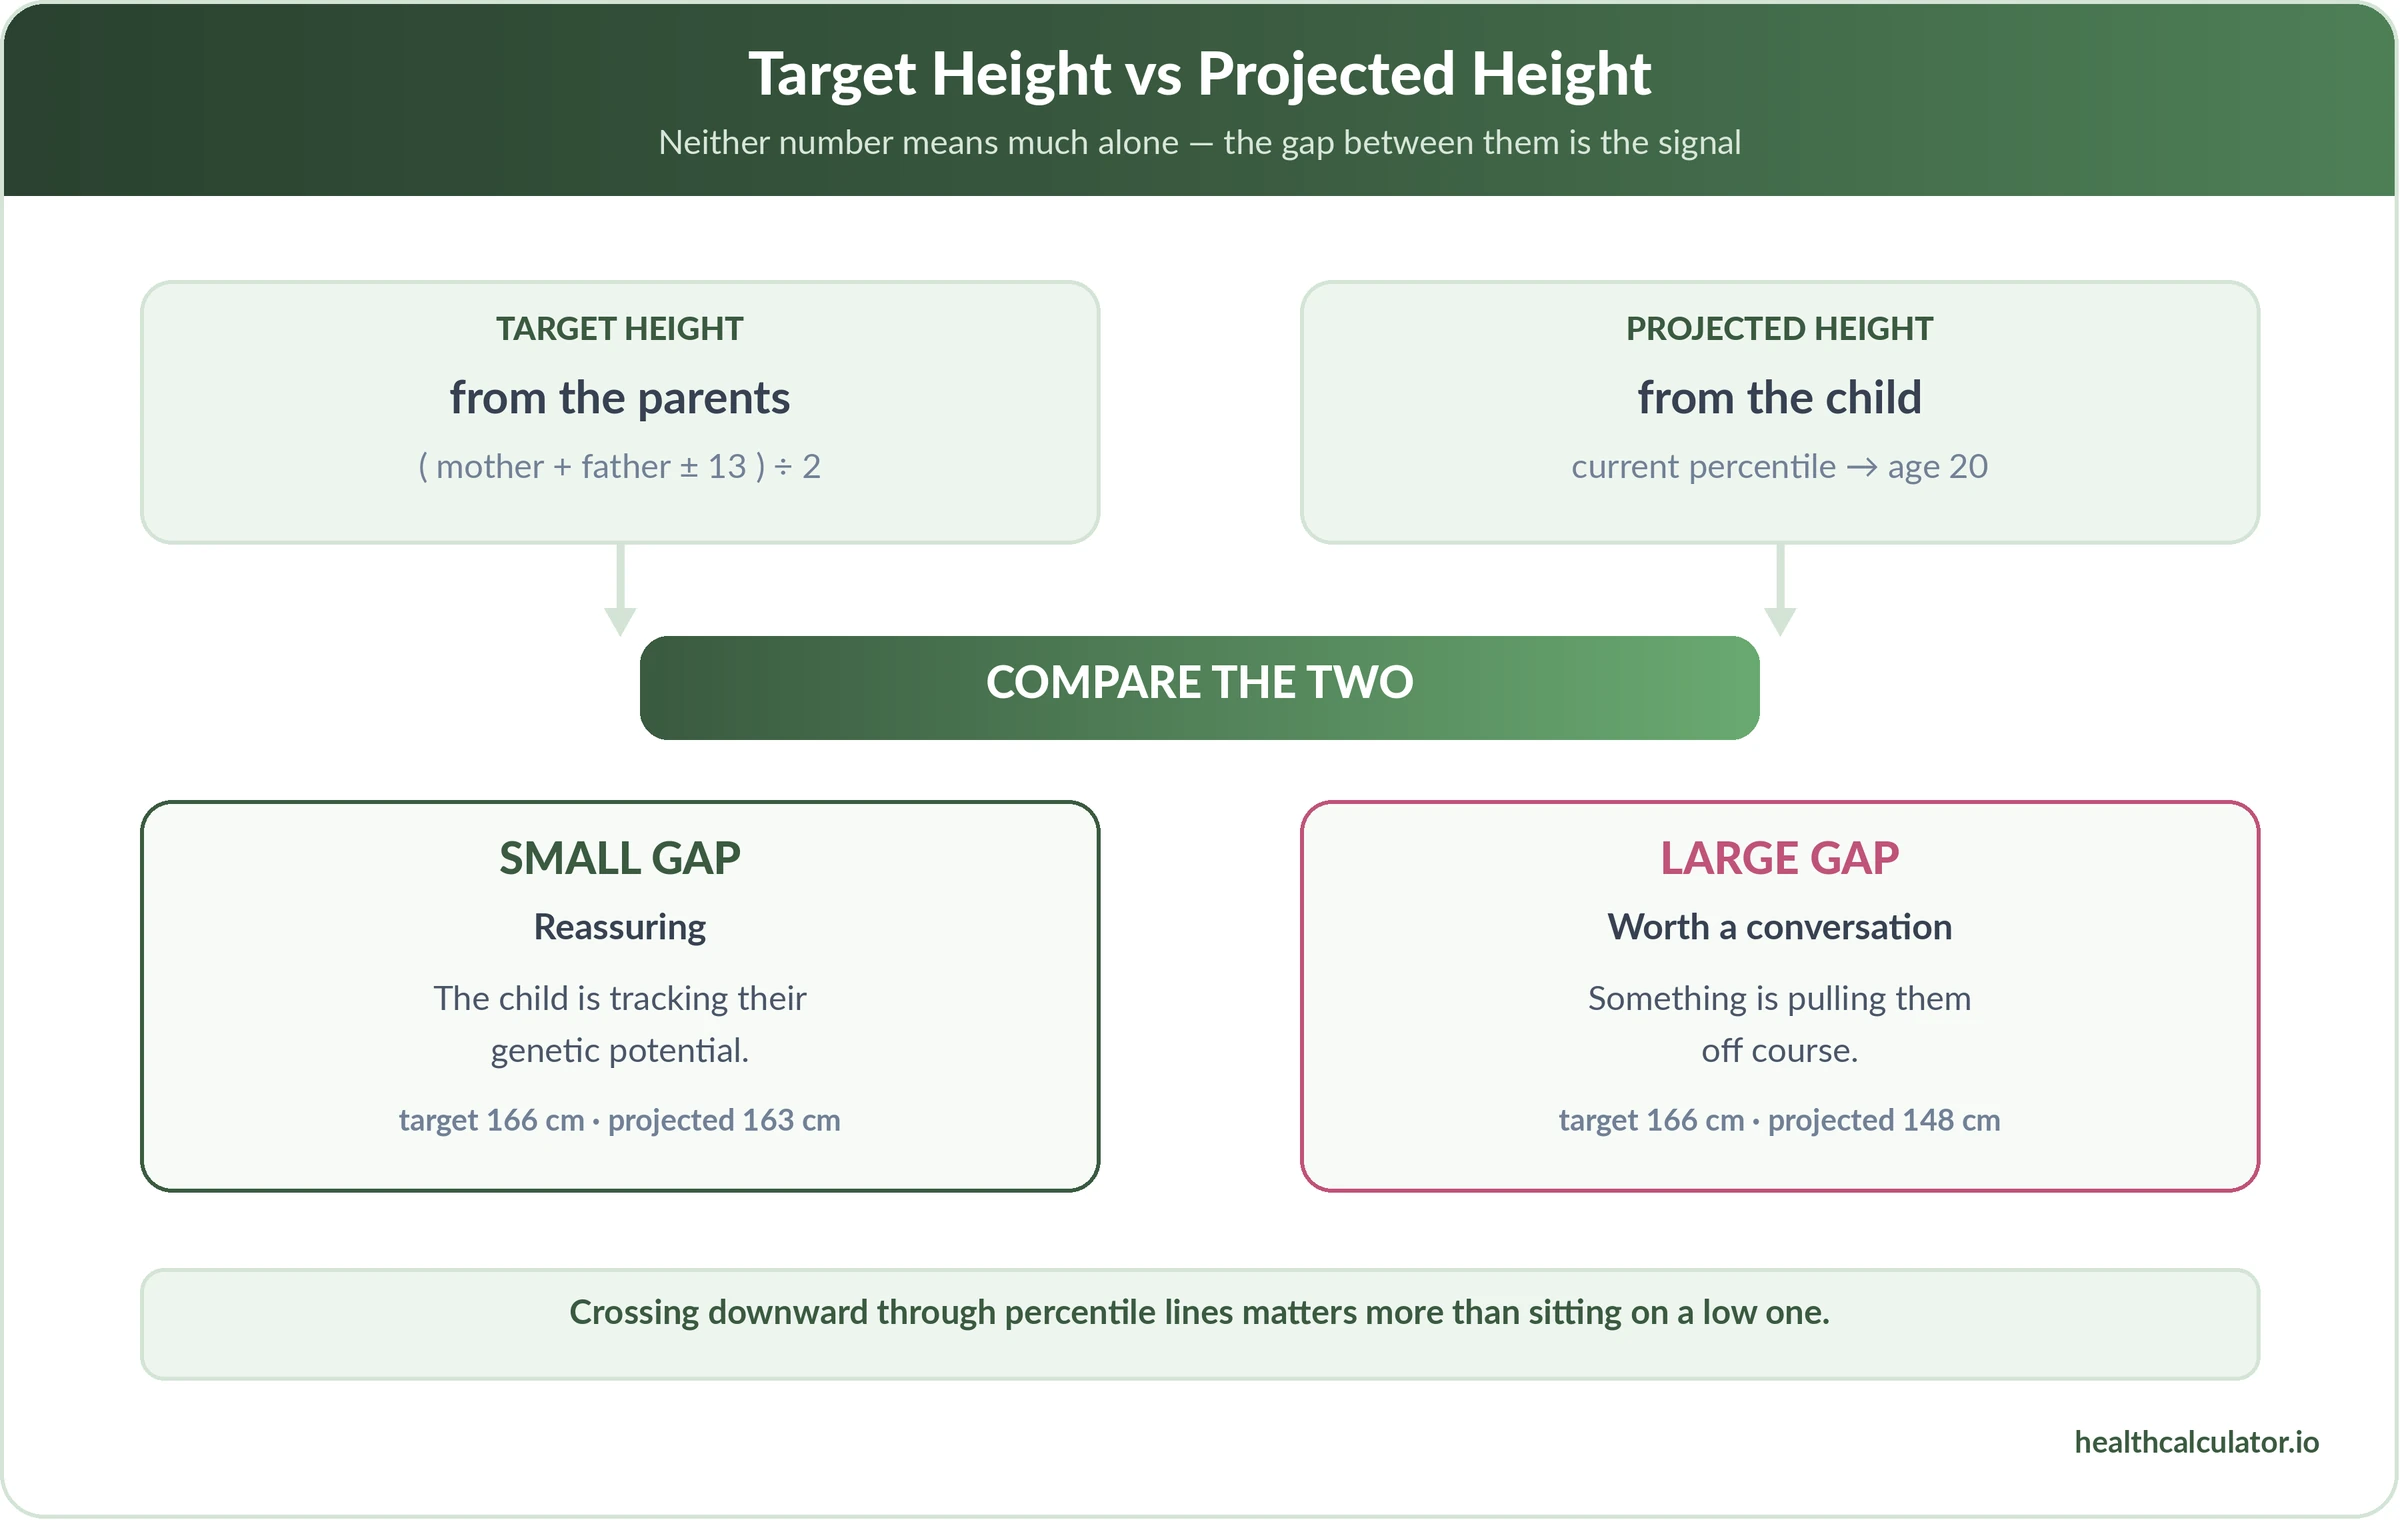
Neither number means much alone. The gap between them is the signal.
A small gap says your child is tracking their genetic potential — reassuring, regardless of whether the number is tall or short. A large gap says something is pulling them off course, and that’s worth a conversation.
This is also why “my child is below average” and “my child has a growth problem” are completely different statements. A child of two short parents sitting at the 5th percentile may be growing exactly as predicted. A child of two tall parents who has fallen from the 75th to the 25th percentile is the one who needs attention, even though they’re still above average.
The CDC is explicit that growth charts are not a diagnostic instrument on their own — they contribute to an overall picture. Same goes for the target height. Two reference lines, read together.
Case Study: Reading One Child’s Prediction
Numbers make this concrete.
Maya is 9. Her mother measures 165 cm, her father 180 cm. Target height for a daughter:
(165 + 180 − 13) ÷ 2 = 166 cm — about 5’5″, the same as her mother.
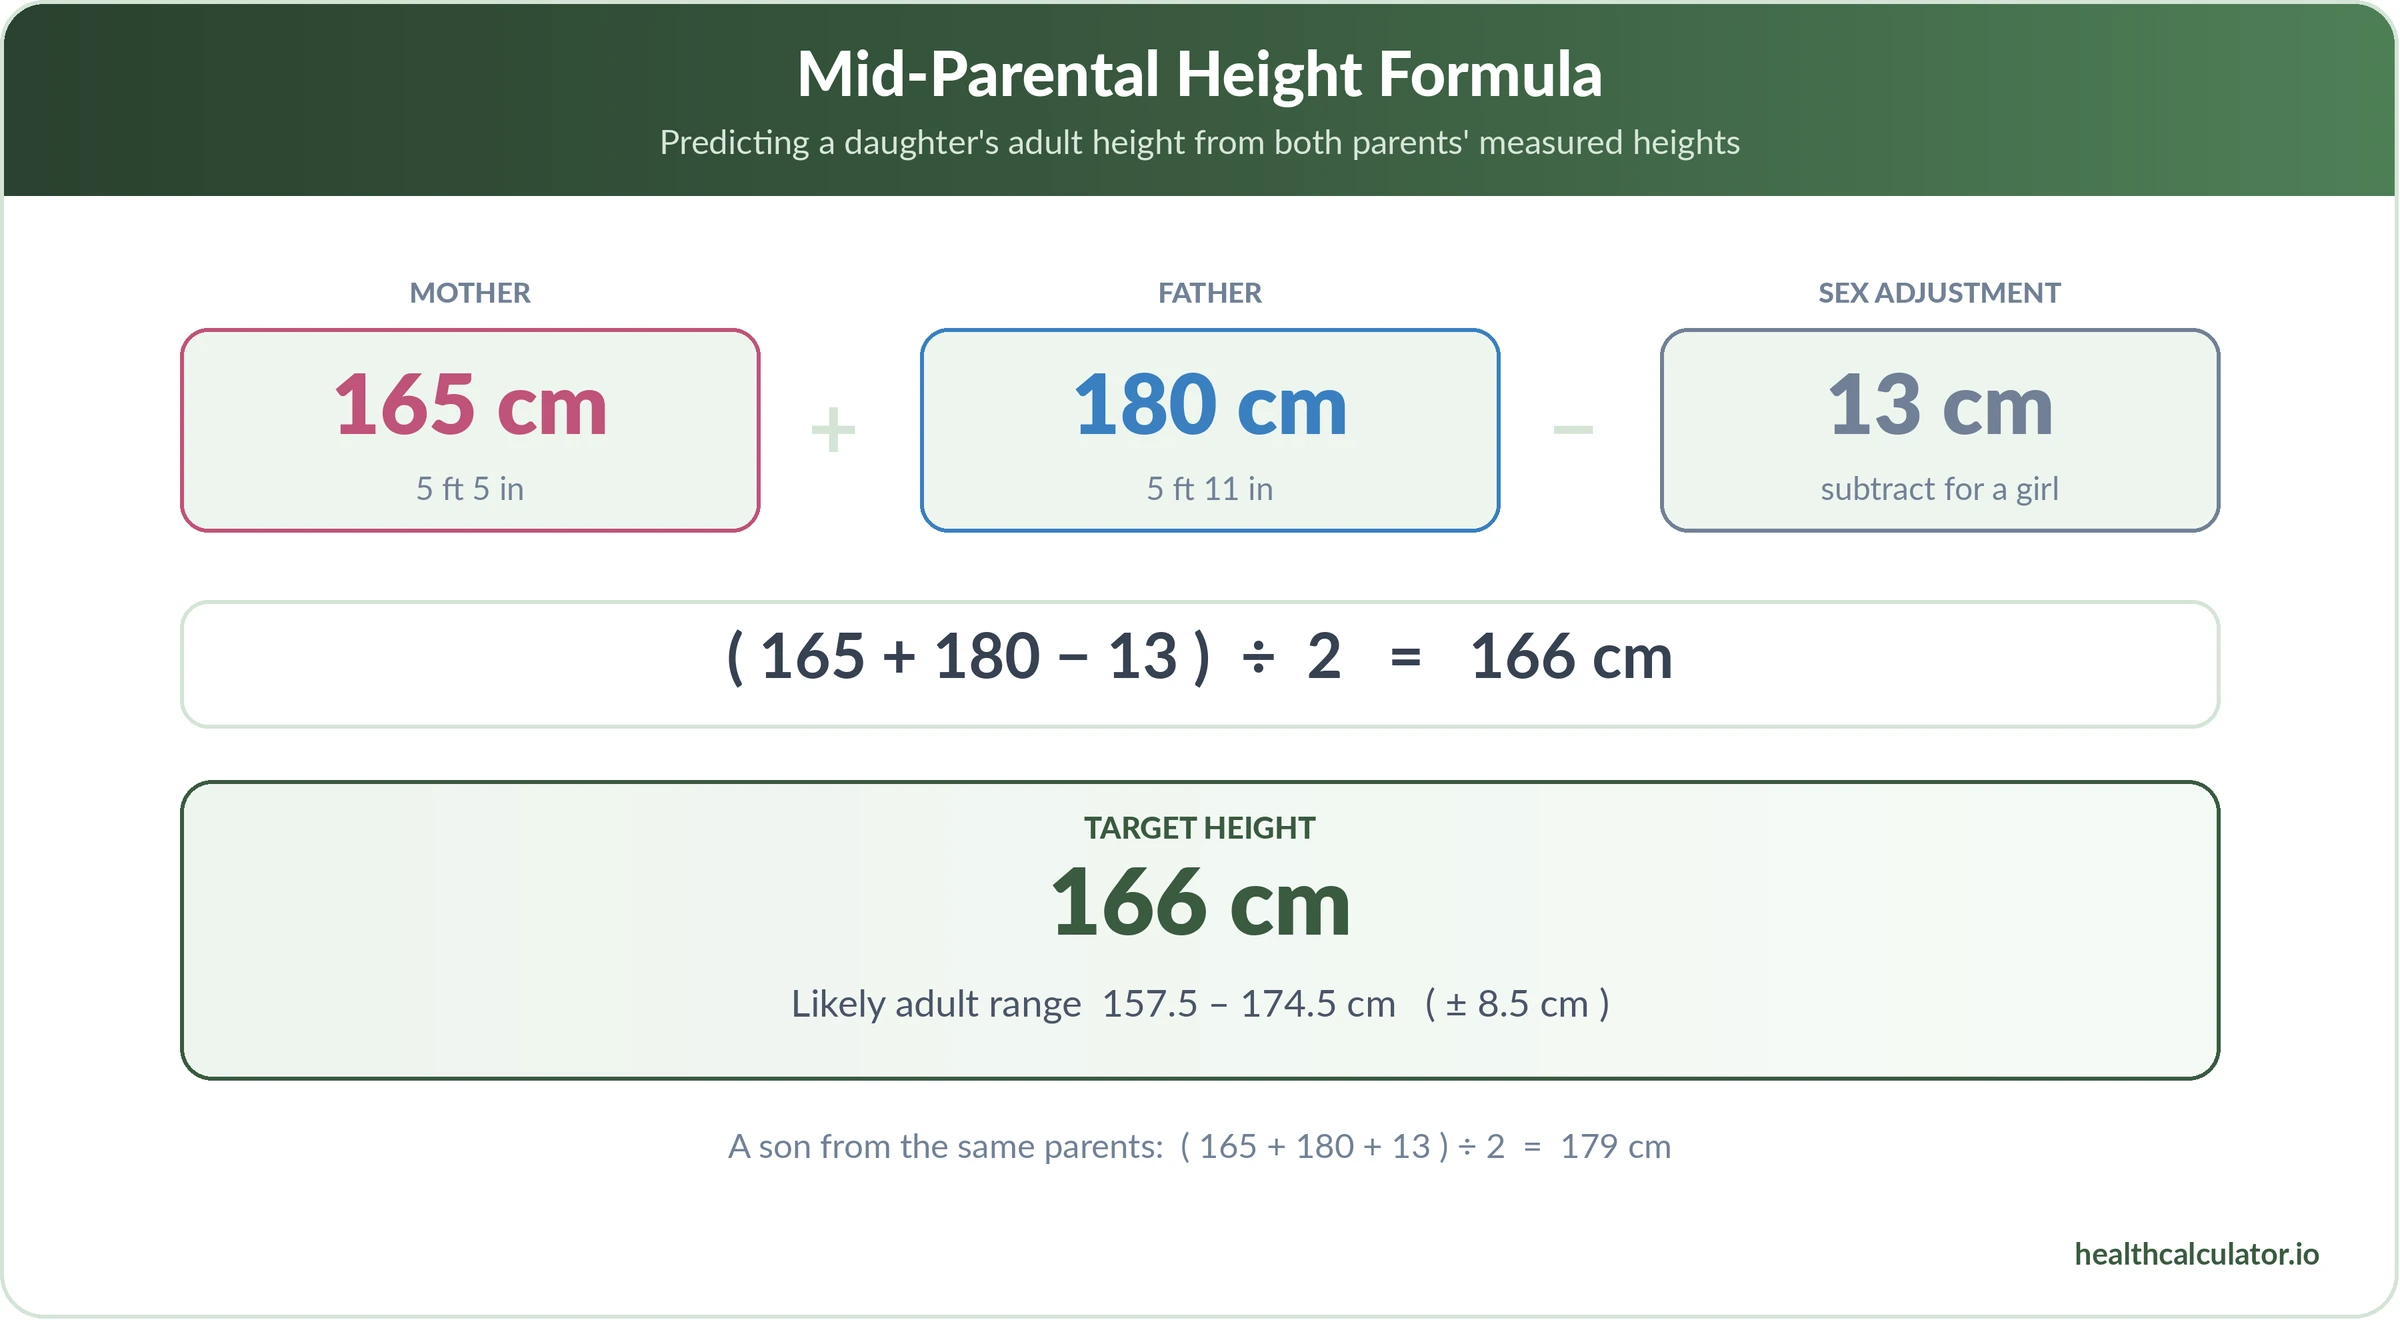
Apply the range and Maya’s likely adult height sits anywhere between 157.5 cm and 174.5 cm. Seventeen centimeters of spread. Both ends are entirely normal outcomes for these two parents, which should tell you something about how much weight the midpoint deserves.
Now the part that matters. Maya currently measures 133 cm, roughly the 50th percentile for her age. Extend that percentile to adulthood and she projects to about 163 cm. Target 166, projected 163 — a 3 cm gap, comfortably inside the noise. Nothing here needs a specialist.
Change one number. Suppose Maya were 118 cm at 9, below the 3rd percentile, projecting to roughly 148 cm. Same parents, same 166 cm target, but now an 18 cm shortfall. That’s the pattern that earns a referral.
Notice what changed: not the target height. The target was identical in both scenarios. The entire signal came from Maya’s own measurements — which is exactly why a prediction built only on parental heights can never tell you whether a child is in trouble.
How Much Should You Trust the Number?
Less than you’d like, and in a predictable direction.
A 2024 study took an unusual approach: instead of many small families, it followed 23 very large ones — a mean of 11 adult children each, all finished growing. That let researchers test one mid-parental prediction against a dozen real outcomes from the same gene pool. Standard mid-parental height explained 36% of the variance in the children’s adult heights.
Two findings are worth carrying around.
It runs low. Children came in an average of 2.7 cm taller than their target predicted — most likely because nobody corrects parental heights for age-related shrinkage.
Extremes get pulled toward the middle. Very tall parents tend to have children shorter than the formula says; very short parents, taller. The researchers measured this pull at r = −0.47. Galton described the effect over 130 years ago — it’s the paper that gave statistics the word “regression” — and clinics still don’t correct for it.
A practical rule falls out of that. If you and your partner are both well above average, expect your child in the lower half of the predicted range. Both well below average? Lean toward the upper half. Near average? The midpoint is a fair bet.
And the ±8.5 cm band deserves a caveat of its own. Tanner derived it theoretically, not from following children to adulthood, and later widened it to ±9 cm for girls and ±10 cm for boys. Other researchers put the 95% interval at ±10.6 cm and ±11.7 cm respectively.
The international consensus statement from the Growth Hormone Research Society, the Lawson Wilkins Pediatric Endocrine Society and ESPE puts it plainly: predicted height may be inaccurate and is not an absolute criterion for treatment decisions. If specialists won’t treat a prediction as definitive, neither should a parent at a kitchen table.
When the Prediction Gets More Reliable
Age does most of the work here, because the biggest unknown in any childhood prediction is puberty timing — and once puberty starts, that unknown resolves itself.
Girls’ growth spurt peaks around age 11.5 and slows around 16. Boys run later, peaking near 13.5 and slowing around 18.
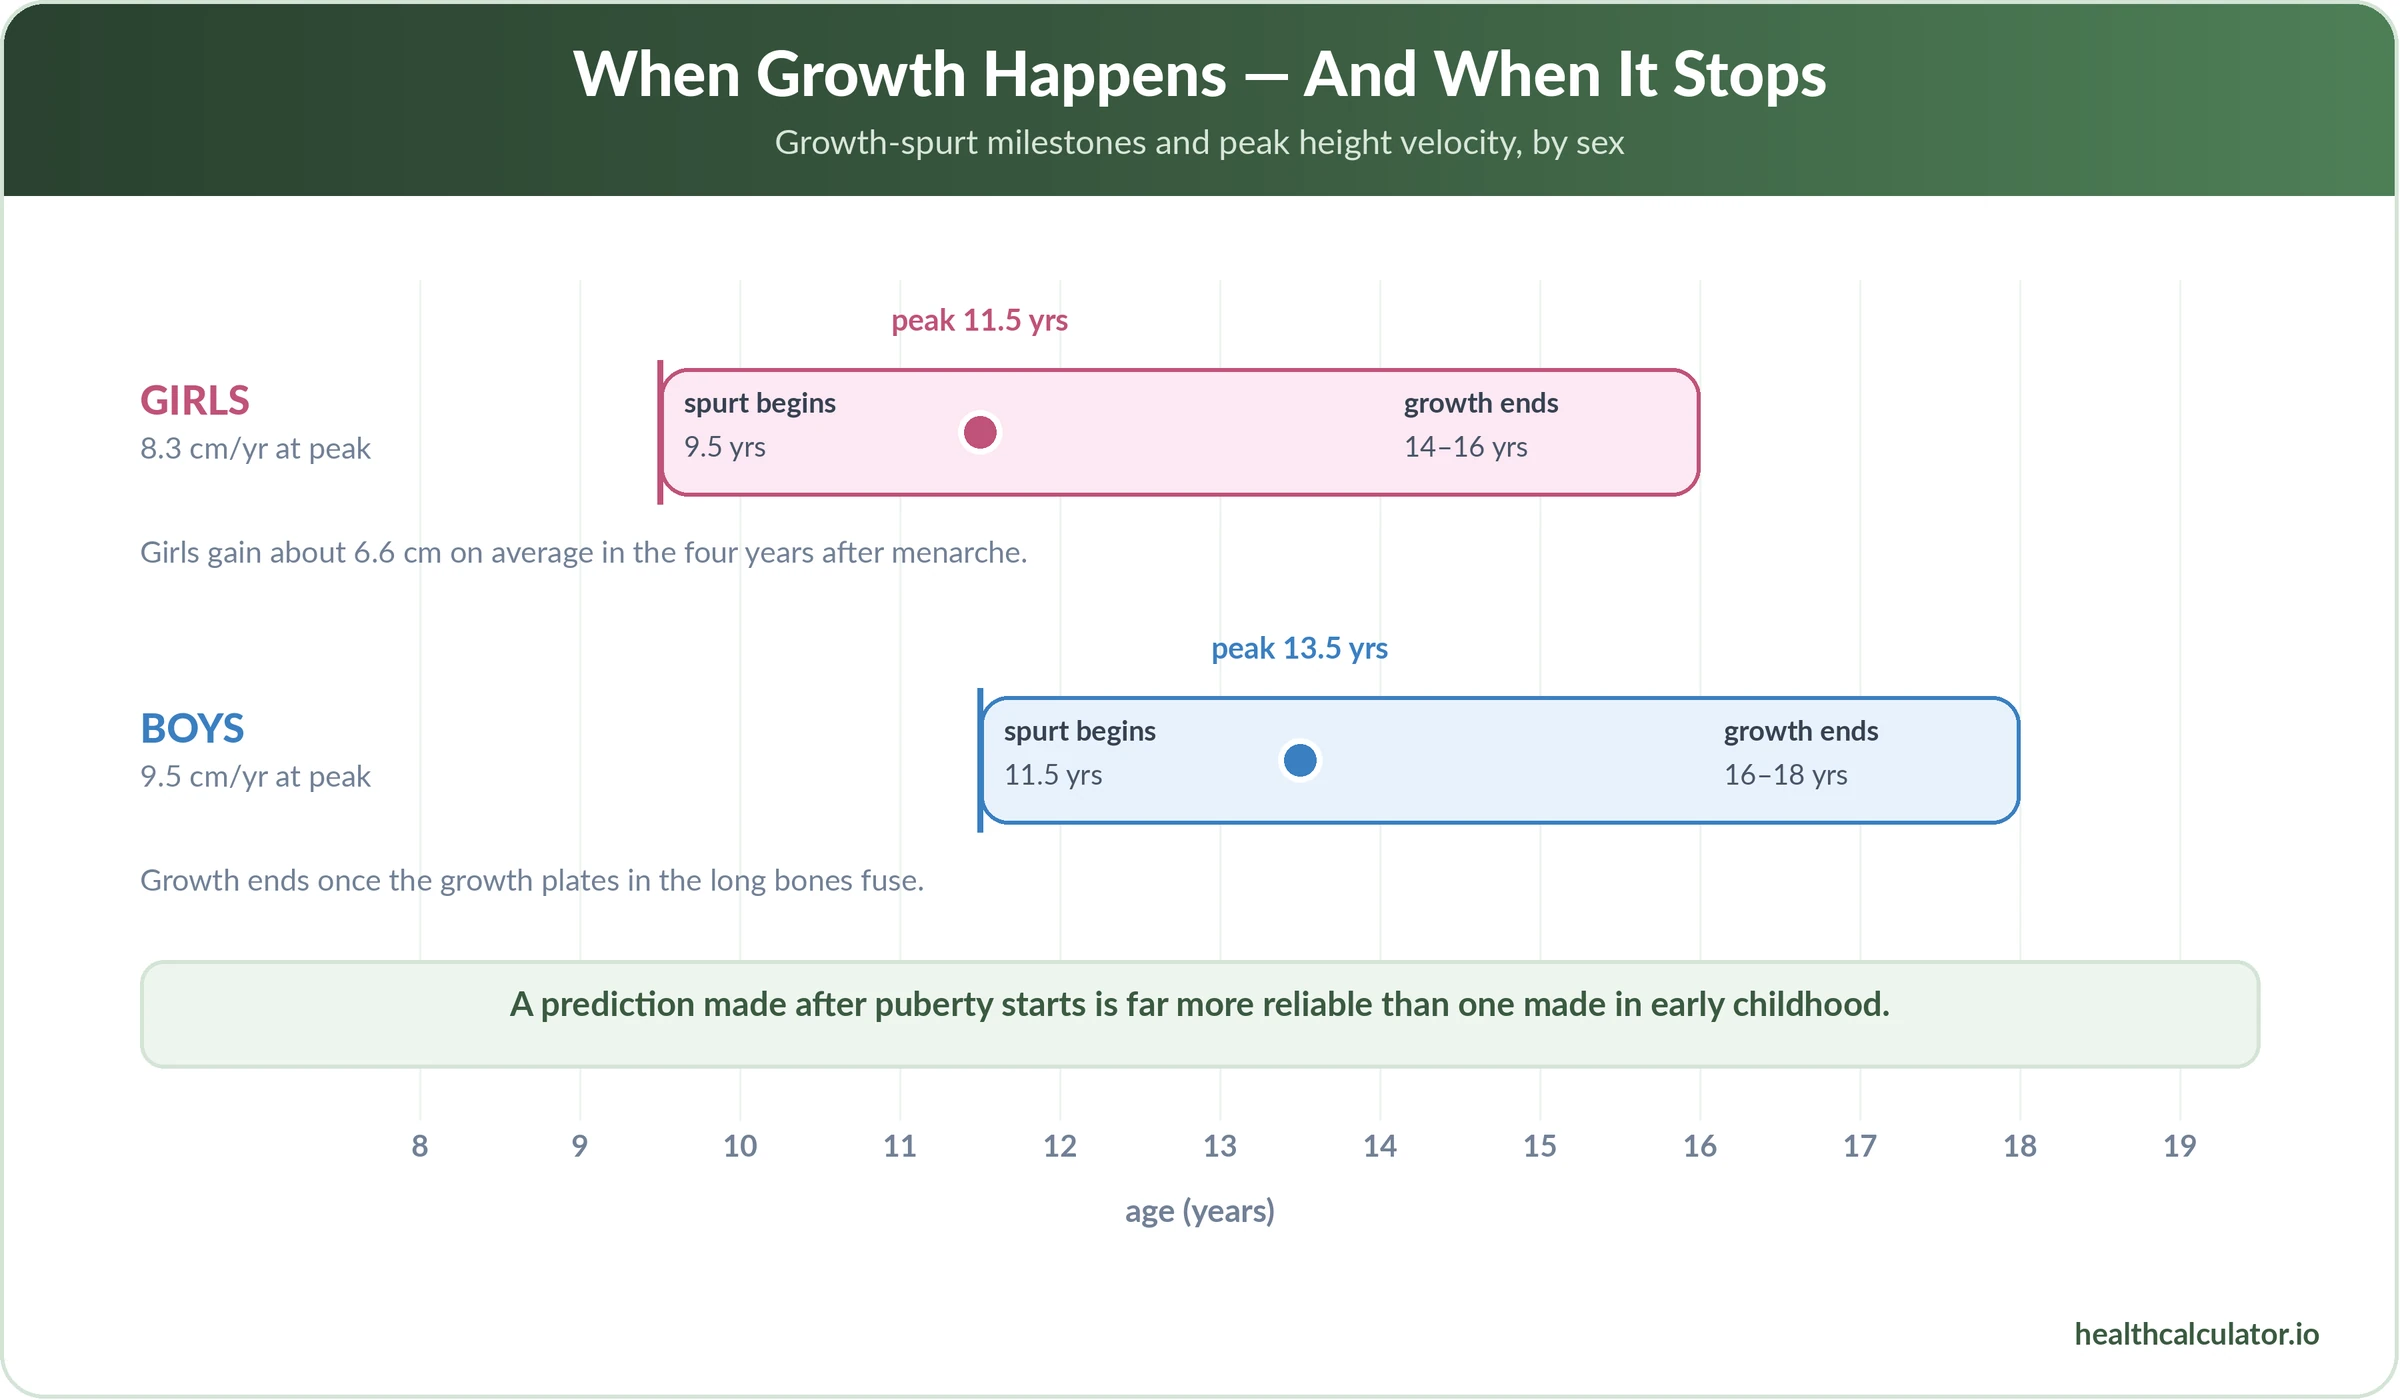
Before the spurt, a prediction is essentially a genetic average with a wide band around it. During and after it, a clinician can see how far along a child is, add a bone-age reading if needed, and narrow the estimate considerably.
Adding the child’s own measurements helps at any age. The Khamis-Roche method — published in Pediatrics in 1994 and built on the Fels Longitudinal Study — uses the child’s age, height and weight alongside parental heights, and roughly halves the error band. A 2026 validation study in Jornal de Pediatria tested it against Tanner-Whitehouse-3 bone age in 371 Portuguese children aged 11 to 15. The mean difference was 0.2 ± 4.2 cm in boys and 0.6 ± 3.1 cm in girls, neither statistically significant, with agreement above 0.91. A method needing no radiation performed about as well as one needing an X-ray.
How much do girls grow after their first period?
More than most parents expect, and it depends heavily on timing.
A prospective study followed 534 girls for four years after menarche. Average total gain: 6.6 ± 2.5 cm, with more than half of it — 3.8 ± 1.5 cm — arriving in the first year alone.
Timing changed the total substantially. Girls whose first period came before age 11 gained 8.2 ± 3.2 cm over those four years. Girls who started after 13 gained just 4.4 ± 1.6 cm. Earlier menarche, more post-menarche growth — which runs against most parents’ intuition.
When to Call the Pediatrician
Formulas don’t diagnose. These patterns are the ones worth raising:
- Your child has crossed downward through percentile lines rather than tracking steadily along one
- Projected height sits 8–10 cm or more below target height
- Height is below the 3rd percentile for age and sex — clinically, short stature is defined as below −2 standard deviations
- Growth has slowed or stalled before puberty has started
- Puberty has arrived conspicuously early or late relative to the ages above
- One sibling’s growth pattern diverges sharply from the others with no family explanation
The first one carries the most weight. A child sitting steadily at the 5th percentile is usually just a small child. A child falling from the 50th to the 10th is telling you something, and that’s true whatever the target height says.
If you’re tracking growth against your child’s exact age, our chronological age calculator gives you the decimal age these charts and formulas expect.
This article is for informational purposes only and does not constitute medical advice or diagnosis. Height predictions are statistical estimates carrying a wide margin of error, and a result outside the expected range is not a diagnosis of anything. Always consult a qualified healthcare professional about concerns regarding your child’s growth.
Frequently Asked Questions
Target height is what genetics predicts — the mid-parental figure from both parents’ heights. Projected height is where your child is actually heading, found by extending their current growth-chart percentile to adulthood. Pediatricians compare the two. A large gap between them, not a low number on its own, is what prompts further evaluation.
Shoes off, heels, bottom and shoulders against a flat wall, eyes looking straight ahead. Place a flat object on their head parallel to the floor, mark the wall, and measure from the floor. Measure at the same time of day each time — people are measurably taller in the morning. Small technique errors matter more than most parents realize, because you’re tracking changes of a few centimeters a year.
Usually not. Steady growth along a consistent percentile line, even a low one, generally reflects a child following their own genetic curve. Crossing downward through percentile lines is the pattern that warrants attention. If both parents are short and your child’s projected height sits close to their target height, that’s a consistent picture rather than a concerning one — but any persistent worry is worth a pediatrician’s opinion.
Two effects both push that way. Regression to the mean pulls children of shorter-than-average parents toward the population average. On top of that, mid-parental height systematically under-predicts — one 2024 study found children finished an average of 2.7 cm taller than their target, likely because parental heights are measured after adults have already begun losing height.
Reliability climbs with age and jumps once puberty begins, because puberty timing is the largest unknown in any childhood prediction. Estimates made in early childhood carry the widest error. By 12 to 14, a clinician can assess pubertal stage and add a bone-age reading, which tightens things considerably. Once growth plates fuse, remaining growth is under a centimeter a year.
Yes. The mid-parental method is least reliable when parents’ heights are far apart, because averaging two very different numbers produces a midpoint that may not reflect either parent’s genetic contribution well. It’s also least reliable when either parent is far from average height, where regression to the mean has the strongest effect. Predictions are most dependable when both parents sit near the population average.
That’s a decision for your pediatrician, not something to request preemptively. Bone age is the most precise input available and reveals whether a child is running ahead of or behind their chronological clock — which matters enormously for a suspected late bloomer. But it involves radiation and is ordered when there’s a clinical reason, typically a meaningful gap between projected and target height or a concerning growth pattern.
Mid-parental height needs both parents, so an unknown height leaves you without a reliable target — and substituting an estimate is risky, since research shows partner-reported heights are the least accurate of all. Better to work from the child’s own growth instead: a pediatrician can track their percentile over time and apply methods that use the child’s measurements. The same applies for adopted children where biological parental heights aren’t available.
Sources
Every figure on this page is drawn from government health statistics or peer-reviewed research. Last verified August 2026.
- Braziuniene I, Wilson TA, Lane AH. Accuracy of self-reported height measurements in parents and its effect on mid-parental target height calculation. BMC Endocrine Disorders. 2007;7:2. doi:10.1186/1472-6823-7-2.
- Zeevi D, Ben Yehuda A, Nathan D, Zangen D, Kruglyak L. Accurate Prediction of Children’s Target Height from Their Mid-Parental Height. Children (Basel). 2024;11(8):916. doi:10.3390/children11080916.
- National Center for Health Statistics. Growth Charts. Centers for Disease Control and Prevention; reviewed 2 September 2024.
- Cohen P, Rogol AD, Deal CL, et al. Consensus Statement on the Diagnosis and Treatment of Children with Idiopathic Short Stature. The Journal of Clinical Endocrinology & Metabolism. 2008 Nov;93(11):4210–4217. doi:10.1210/jc.2008-0509.
- MedlinePlus Medical Encyclopedia. Adolescent development. National Library of Medicine; reviewed 1 January 2025.
- Khamis HJ, Roche AF. Predicting adult stature without using skeletal age: the Khamis-Roche method. Pediatrics. 1994 Oct;94(4 Pt 1):504–507. Erratum in: Pediatrics. 1995 Mar;95(3):457.
- Fragoso I, Albuquerque F, Teles J, et al. Validity of the Khamis-Roche method, relative to bone age, in Portuguese children and adolescents from 11 to 15 years. Jornal de Pediatria. 2026.
- Gaete X, Ferrer-Rosende P, Pereira A, Mericq V. Post-Menarcheal Growth Patterns in a Contemporary Cohort of Latino Girls. Hormone Research in Paediatrics. 2025;98(1):66–74. doi:10.1159/000536506.